Interface utilisateur
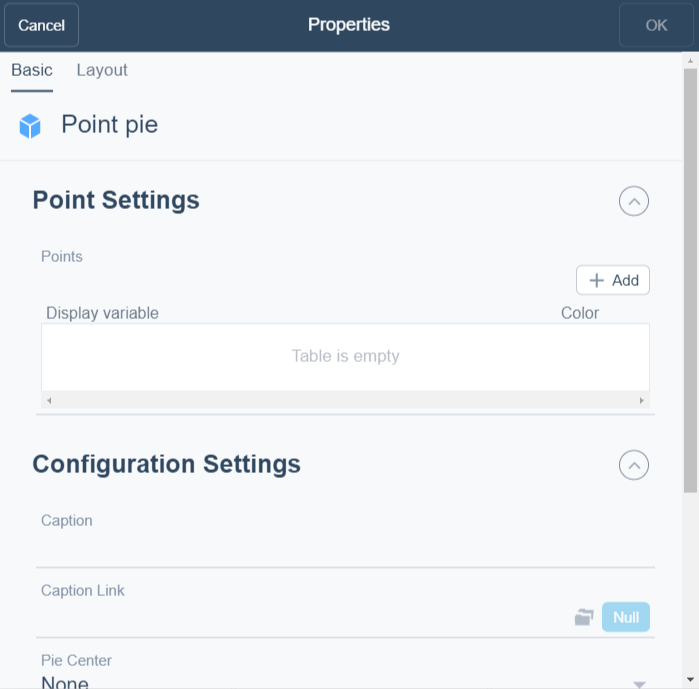
Boîte de dialogue Propriétés du graphique de point
La boîte de dialogue Propriétés du graphique de point vous permet de configurer et de modifier un graphique de point.

|
Composant |
Description |
|
Ajouter |
Click to add a point. |
|
Afficher variable |
Enter the variable you want to display. |
|
Couleur |
Sélectionnez la couleur à attribuer à la variable. |
|
Légende |
Type a caption for the widget. |
|
Lien légende |
Select to make a link to an object that is relevant to the values that are displayed in the widget. |
|
Centre du graphique circulaire |
Select how you want to display the pie center. Pour plus d'informations, voir Graphique circulaire de point . |
|
Afficher la légende |
Click True to display the name and color of the trend log in the widget. |
|
Afficher pourcentages |
Select to display the values in percentage. |
|
Afficher valeurs |
Sélectionnez pour afficher les valeurs numériques. |
 Widgets de tableau de bord
 Graphique circulaire de point
 Boîte de dialogue Widget – Onglet Agencement