Log on to rate and give feedback
1
2
3
4
5
Log on to rate
0

Interfaz de usuario
Productos
WebStation
Funcionalidades:
Dashboards
Versión del producto:
2022, 2023, 2024
14/03/2024
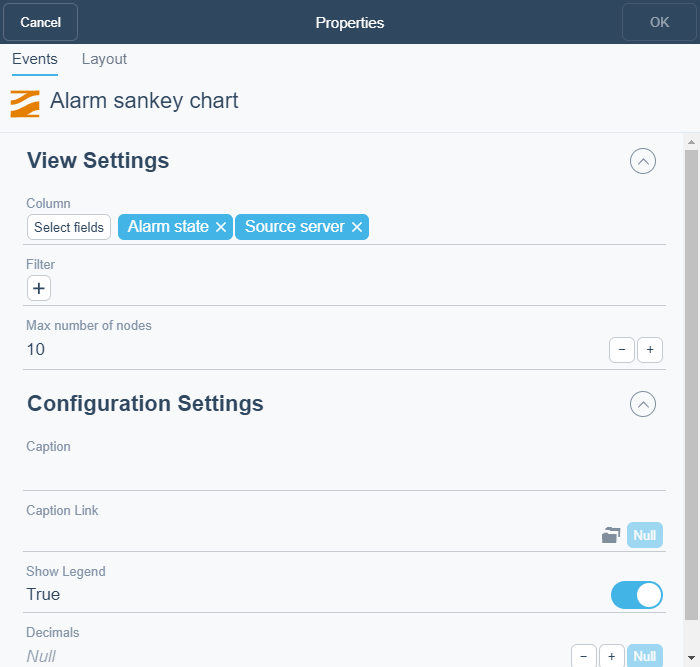
Cuadro de diálogo de Gráfico de Sankey de alarmas
Use el cuadro de diálogo Gráfico de Sankey de alarmas para configurar y editar un gráfico de Sankey de alarmas.

Figura:
Cuadro de diálogo de Gráfico de Sankey de alarmas
|
Componente |
Descripción |
|
Columna |
Select the column(s) you want to display in the widget. |
|
Filtro |
Select the filter you want to apply. |
|
Número máximo de nodos |
Enter the number of bars you want to display in the chart. |
|
Leyenda |
Type a caption for the widget. |
|
Enlace de leyenda |
Select to make a link to an object that is relevant to the values that are displayed in the widget. |
|
Mostrar leyenda |
Click True to display the name and color of the trend log in the widget. |
|
Decimales |
Select the number of decimals you want to display. |
 Cómo funcionan los paneles
 Widgets de panel
 Cuadro de diálogo del widget – Pestaña de diseño