用户界面
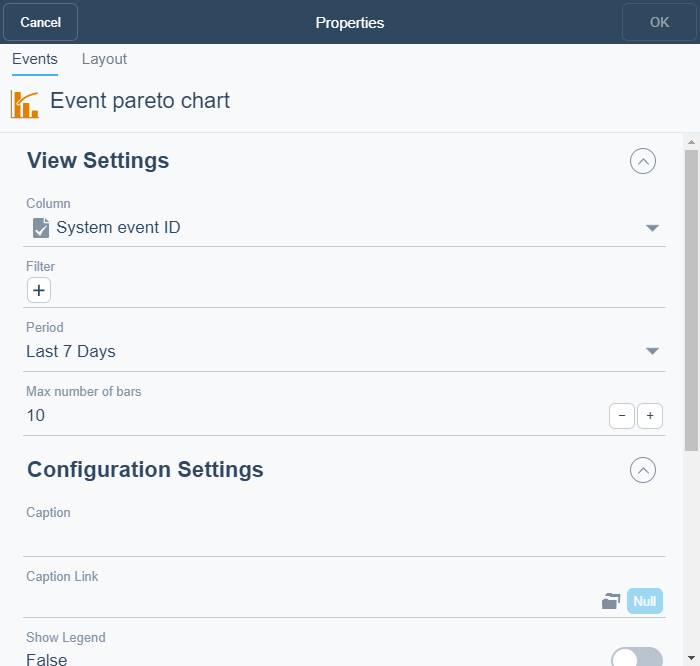
事件帕累托图对话框
使用 事件帕累托图表 对话框可以配置和编辑事件帕累托图。

|
组件 |
描述 |
|
列 |
Select the column(s) you want to display in the widget. |
|
过滤器 |
Select the filter you want to apply. |
|
周期 |
Select the period you want to display. |
|
最大栏数 |
Enter the number of bars you want to display in the chart. |
|
标题 |
Type a caption for the widget. |
|
标题链接 |
Select to make a link to an object that is relevant to the values that are displayed in the widget. |
|
显示图例 |
Click True to display the name and color of the trend log in the widget. |
|
栏颜色 |
Select the color you want to use on the bars. |
|
Y-轴最小值 |
Enter the Y-axis minimum. |
|
显示时间段 |
Select to display the period as a legend. |
|
Y-轴最大值 |
Enter the Y-axis maximum. |
|
十进制 |
Select the number of decimals you want to display. |
 仪表板的工作方式
 Dashboard Widgets
 小部件对话框 - 布局选项卡