Interfaz de usuario
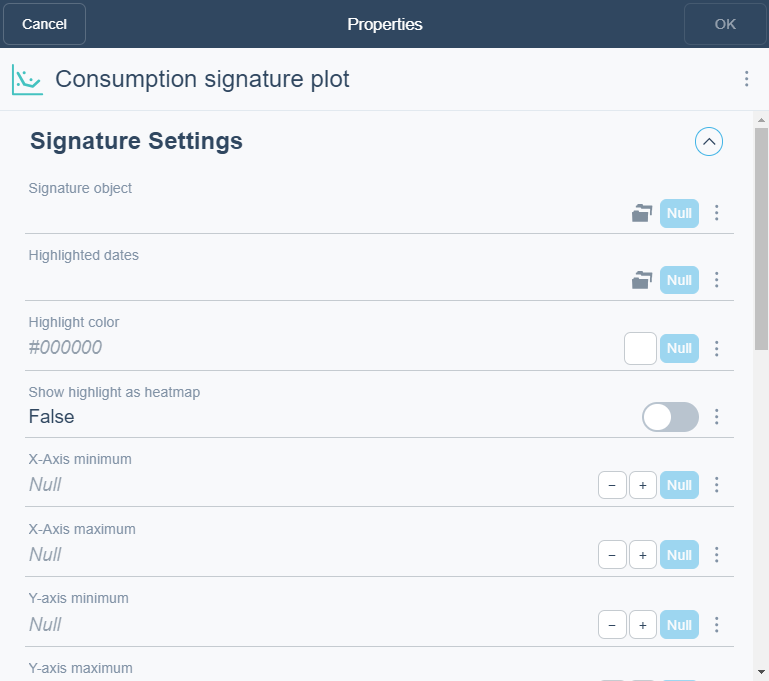
Cuadro de diálogo del widget del diagrama de una firma de consumo
Utilice el cuadro de diálogo del Widget del Diagrama de una firma de consumo para configurar y editar un widget de diagrama de una firma de consumo.

|
Componente |
Descripción |
|
Objeto de firma |
Seleccione la firma del consumo que desea mostrar en el widget. |
|
Fechas destacadas |
Seleccione un calendario que defina el día que tiene un color diferente a partir de uno en la curva de firma. |
|
Color de resaltado |
Enter the number of bars you want to display in the chart. |
|
Mostrar lo resaltado como mapa de calor |
Seleccione Verdadero para mostrar la información graficada como un mapa de calor. |
|
Eje X mínimo |
Enter the Y-axis minimum.
|
|
Eje X máximo |
Enter the Y-axis maximum. |
|
Eje Y mínimo |
Enter the Y-axis minimum. |
|
Eje Y máximo |
Enter the Y-axis maximum. |
|
Decimales |
Select the number of decimals you want to display. |
|
Leyenda |
Type a caption for the widget. |
|
Enlace de leyenda |
Select to make a link to an object that is relevant to the values that are displayed in the widget. |
|
Mostrar leyenda |
Click True to display the name and color of the trend log in the widget. |
|
Mostrar límites de alarma |
Click True to show alarm limits. |
|
Color del límite de alarma |
Seleccione el color para los límites de alarmas. |
|
Mostrar la línea prevista |
Seleccione Verdadero para mostrar la línea de firma de consumo esperada. |
|
Mostrar líneas de cuadrícula |
Click True to show gridlines. |
|
Mostrar período |
Click True to show period. |
 Widgets de panel
 Diagrama XY
 Cuadro de diálogo del widget – Pestaña de diseño