Log on to rate and give feedback
1
2
3
4
5
Log on to rate
0

User Interface
Products:
WebStation
Functionalities:
Dashboards
Product version:
7.0
12/19/2024
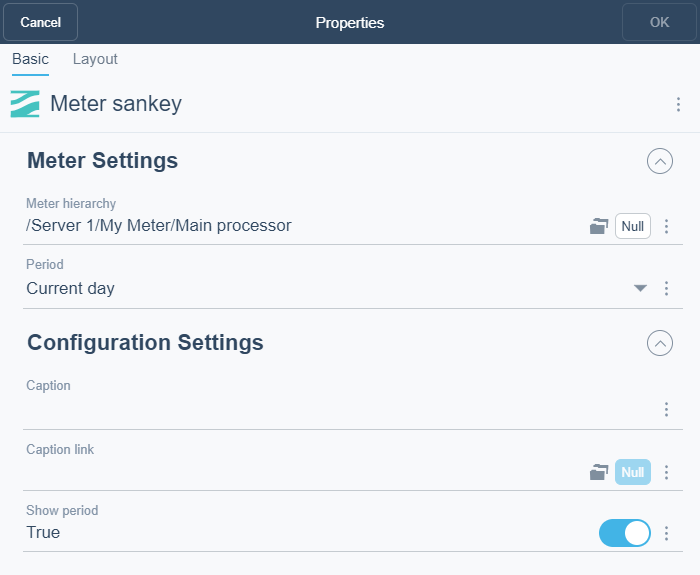
Meter Sankey Chart Dialog Box
Use the Meter Sankey Chart dialog box to configure and edit an meter sankey chart.

Figure:
Meter Sankey chart dialog box
|
Component |
Description |
|
Meter hierarchy |
text |
|
Period |
Select the period you want to display. |
|
Caption |
Type a caption for the widget. |
|
Caption Link |
Select to make a link to an object that is relevant to the values that are displayed in the widget. |
|
Show Period |
Click True to display the name and color of the trend log in the widget. |
 How Dashboards Work
 Dashboard Widgets
 Widget Dialog Box – Layout Tab