earth_america
user_standard Iniciar sesión
action_search_stroke
earth_america
Log on to rate and give feedback 1 2 3 4 5 Log on to rate
0
Explicación de procesos

Explicación de procesos


Productos AS-C, AS-B, Enterprise Server, AS-P, WorkStation, Project Configuration Server, Project Configuration Tool
Funcionalidades: Tendencias
Versión del producto: 1.8
13/10/2016

Adding a Real-Time Trend Series to a Trend Chart

You add a real-time trend series to a trend chart to compare trend data from different logs or variables.

Mostrar más
action_close

In a trend chart, a series can be presented as a line, discrete line, digital, or bars. In a trend chart, series can be presented in different colors and with different line weights.

In a multi trend log list, series are presented as text and can be exported to .XML or .CSV.

 
action_zoom_plus_stroke Types of series presentation, schematic
Figura: Types of series presentation, schematic

To make reading easier in a trend chart, records can be presented with markers. Markers can only be shown for lines and discrete lines, not for digital or bars.

 
action_zoom_plus_stroke Presentation with markers, schematic
Figura: Presentation with markers, schematic

To add a real-time trend series to a trend chart
  1. In WorkStation, in the System Tree pane, select the trend chart you want to add a trend series to. ​

  2. On the File menu, click Properties .

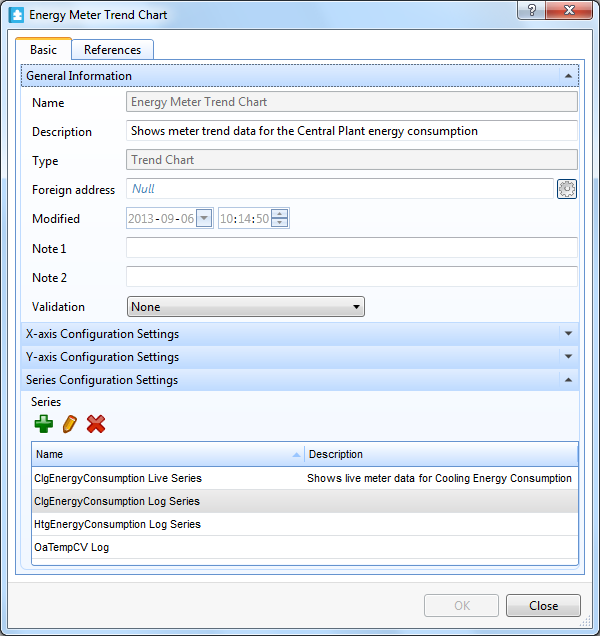
  3. Under Series Configuration Settings , click the Add button

     
    action_zoom_plus_stroke
    .

     
    action_zoom_plus_stroke
  4. In the object type list, select Real Time Trend Series .

     
    action_zoom_plus_stroke
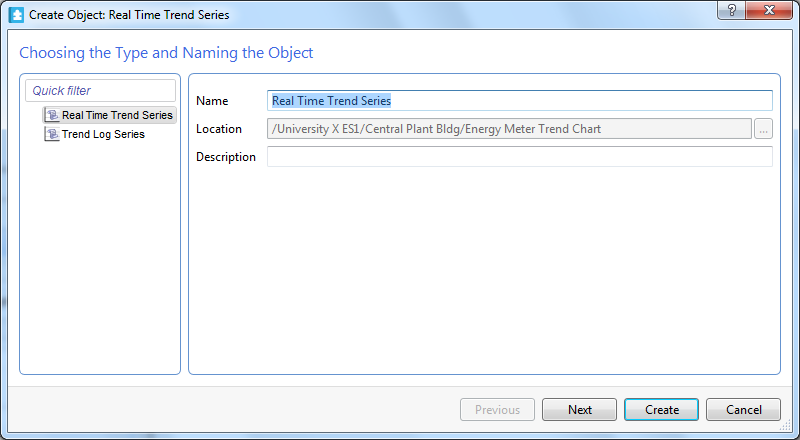
  5. In the Name box, type a name for the series.

  6. In the Description box, type a description for the series.

     
    action_zoom_plus_stroke
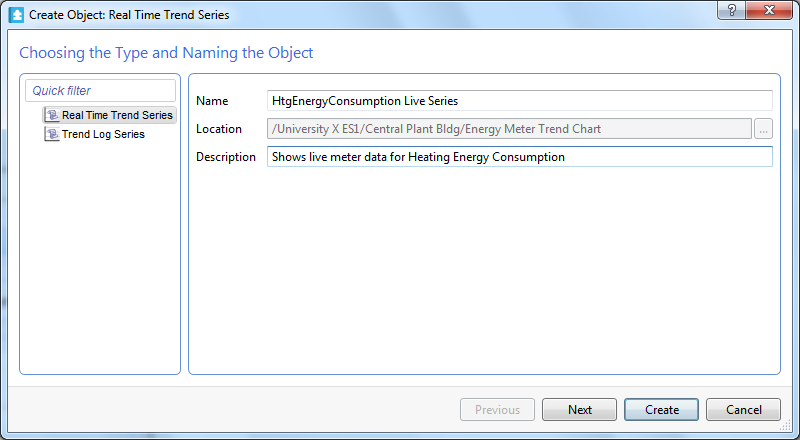
  7. Click Next .

  8. In the Display variable box, enter the path to the variable you want to display in the trend chart.

     
    action_zoom_plus_stroke
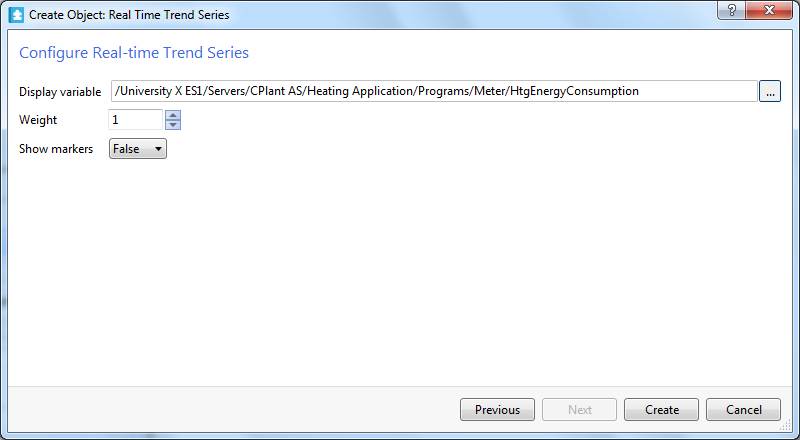
  9. In the Weight box, enter the line weight of the series.

  10. In the Show markers box, select True to display a marker for each recorded value.

     
    action_zoom_plus_stroke
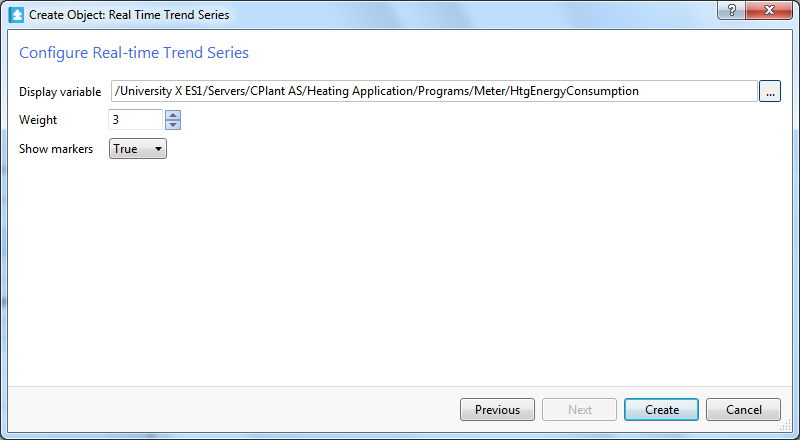
  11. Click Create .

     
    action_zoom_plus_stroke
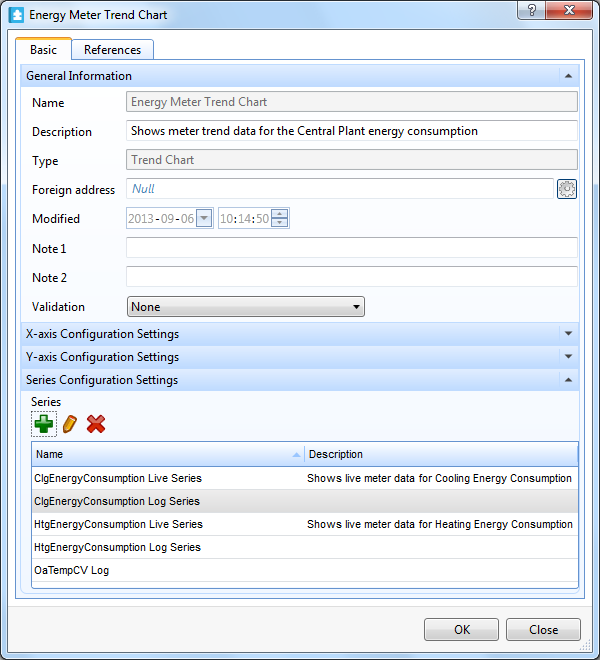
  12. Click OK .

  • Trend Series
  • Cómo eliminar series del gráfico de tendencias
  • Trend Chart View