登录以评价并提供反馈
1
2
3
4
5
登录以评价
0

如何
产品:
AS-C, AS-B, Enterprise Server, AS-P, WorkStation, Project Configuration Tool
功能:
趋势
产品版本:
1.9
2017/7/19
在趋势图中添加趋势日志系列
您可以在趋势图中添加趋势日志系列,以比较不同日志或变量中的趋势数据。
在趋势图中添加趋势日志系列
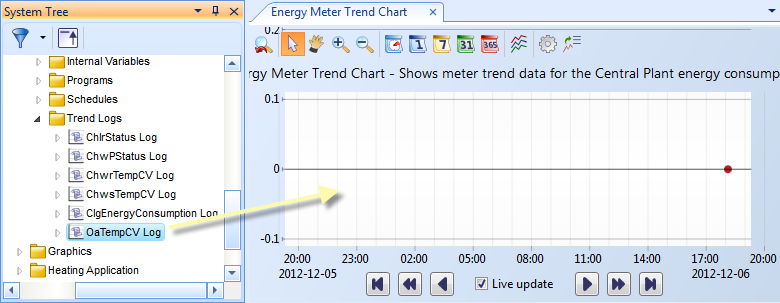
在工作站的 系统树 窗格中,选择要添加趋势日志系列的趋势图。
在 系统树 窗格中,选择要添加的趋势日志。
从 系统树 窗格拖动趋势日志到趋势图。
action_zoom_plus_stroke 
点击 保存 。
 Trend Series
 趋势图事件图标
 移除趋势图系列
 趋势图视图
趋势图视图

