earth_america
user_standard 登录
action_search_stroke
earth_america
登录以评价并提供反馈 1 2 3 4 5 登录以评价
0
如何

如何


产品: AS-C, AS-B, Enterprise Server, AS-P, WorkStation, Project Configuration Tool
功能: 趋势
产品版本: 1.9
2017/7/19

配置趋势图时区

您可以通过本地时间、服务器时间或预定义时区中的时间显示记录的时间。通过更改时区设置,可以轻松解释时间戳。

显示更多
action_close

​In a trend chart, you can present the records of a trend log in different time zones: local time or a predefined time zone.

​A time zone is a region on the earth that has a uniform standard time, usually referred to as the local time. Local time is the UTC time plus the current time zone offset for the considered location. Some time zones also have an offset called DST added during the summer period. The DST offset is typically +1 hour.

Before you set the time zone for a trend chart, you should consider these settings:

  • Computer clock settings​

  • Regional settings

A computer clock displays time that has been set manually or by synchronizing to a time server. The computer clock time shows local time. Regional time displays the time of the selected location. Asynchronous computer clock time and regional time are not uncommon and can cause, for example, unexpected time discrepancies between time stamps on received values and the computer clock time.

​To adjust the SmartStruxure server device time, time zone, and DST, you have to access the SmartStruxure server device through a WorkStation.

Local Time

A trend chart presented in Local time displays trend logs with time stamps adjusted for the client computer time zone.

The client computer does not consider the local time of the SmartStruxure server where the variable is logged. The same variable logged on SmartStruxure servers in different time zones is displayed with matching time stamps for corresponding values.

 
action_zoom_plus_stroke Local time zone, schematic
图: Local time zone, schematic

Predefined Time Zone

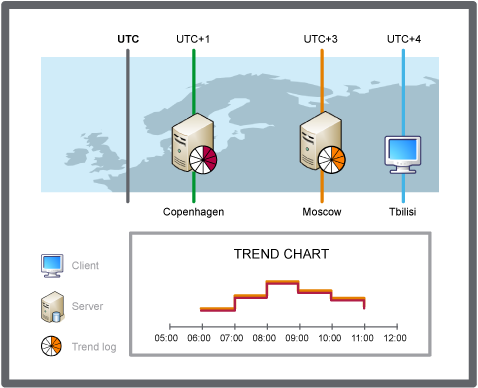
A trend chart presented in a predefined time zone displays trend logs in the time of the selected time zone regardless of where the SmartStruxure server is located.

The same variable logged on SmartStruxure servers in different time zones are displayed with adjusted time stamps for corresponding values. Use predefined time zone when you need to compare trend logs on SmartStruxure servers located in different time zones.​

 
action_zoom_plus_stroke Predefined time zone, schematic
图: Predefined time zone, schematic

配置趋势图时区模式
  1. 在工作站的 系统树 窗格,选择想要配置的趋势图。

  2. 趋势图 工具栏,点击 打开趋势图设置 按钮

     
    action_zoom_plus_stroke

  3. 时区 框中,选择要在其中显示趋势图时间戳的时区:

    • 选择 本地 时间 可通过客户端实时时间显示时间戳。

    • 选择预定义时区可通过所选择时区的实时时间显示时间戳。

     
    action_zoom_plus_stroke
  4. 点击 确定

X 轴现在会根据所选的时区进行设置。

  • Time Zone Modes in a Trend Chart
  • 趋势图事件图标
  • Trend Chart Settings Dialog Box – Axes Tab