earth_america
user_standard 登录
action_search_stroke
earth_america
登录以评价并提供反馈 1 2 3 4 5 登录以评价
0
如何

如何


产品: AS-B, Edge Server, Enterprise Central, Enterprise Server, AS-P, WorkStation, Project Configuration Tool
功能: 趋势
产品版本: 2023
2024/5/21

创建实时绘图趋势图

您可以创建实时绘图趋势图,以实时显示变量。

显示更多
action_close

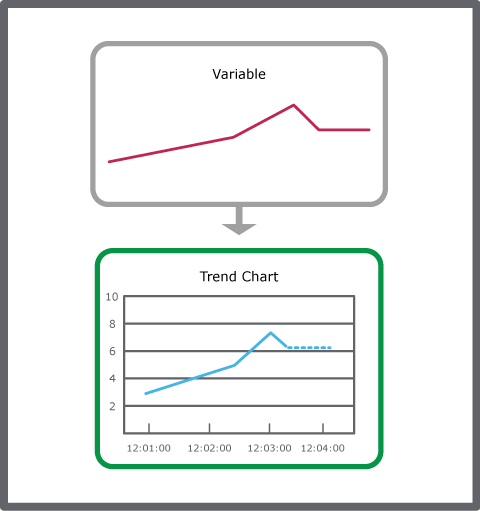
The real-time plot is a variable displayed directly in the trend chart. The real-time plot is an instant reflection of the variable, so the history of the real-time plot is lost when the trend chart is closed. However, the history is not lost for I/O points that have implicit logs where approximately 500 records of history are displayed.

 
action_zoom_plus_stroke Real-time plot, schematic
图: Real-time plot, schematic

A real-time plot trend chart updates and draws a solid series each time it registers that the variable has a new value. If the variable remains on the same value, the series is drawn as a dotted line.

When you save a real-time plot trend chart, a trend chart object is created that you can reach from the System Tree pane.

注释:
  • A real-time plot can only be displayed in a trend chart and not in a trend log list.

创建实时绘图趋势图
  1. 在 WorkStation 的 系统树 窗格中,选择要在实时绘图趋势图中显示的变量。

  2. 操作 菜单中,指向 视图 ,然后点击 新趋势图

  3. 点击 保存 按钮

     
    action_zoom_plus_stroke

  4. 浏览到要保存实时绘图趋势图的位置。

  5. 点击 保存

保存实时绘图趋势图时,会在系统树窗格中创建趋势图对象。

  • Real-Time Plotting
  • 趋势图视图
  • 保存趋势图设置