登录以评价并提供反馈
1
2
3
4
5
登录以评价
0

如何
产品:
AS-B, Edge Server, Enterprise Central, Enterprise Server, AS-P, WorkStation, Project Configuration Tool
功能:
趋势
产品版本:
2023
2024/5/21
创建实时监视变量的趋势图
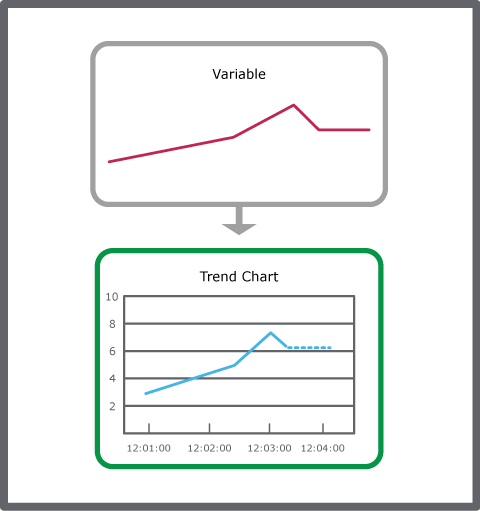
您可以创建实时监视变量的趋势图,例如,以访问和检查变量的当前状态。
创建实时监视变量的趋势图
在 WorkStation 的 系统树 窗格中,选择您想要创建趋势图表的文件夹或 EcoStruxure BMS 服务器。
在 文件 菜单中,指向 新建 ,然后点击 趋势 。
在 创建对象 向导的对象类型类别中选择 趋势图表 。
在 名称 框中,键入趋势图的名称。
在 描述 框中,键入描述。
点击 下一个 。
在 配置趋势图表 页面中的 时间模式 框内,选择 绝对 可手动指定 X 轴开始和结束点。
在 开始时间 框中,键入绝对开始时间(X 轴最左边的点)。
在 结束时间 框中,键入绝对结束时间(X 轴最右边的点)。
在 自动标度左边 Y 轴 框中,选择 是 ,使 Y 轴能够根据显示的系列进行调整。
点击 添加
按钮。action_zoom_plus_stroke 
在 创建对象 向导的对象类型类别中选择 实时趋势系列 。
在 名称 框中,键入系列的名称。
在 描述 框中,键入描述。
点击 下一个 。
在 配置实时趋势系列 页面的 显示变量 框中,输入要在趋势图中显示的变量。
在 粗细 框中,输入系列的线条粗细。
在 显示标记 框中,选择 真 以显示每个记录的值的标记。
点击 创建 。
在 配置实时趋势系列 对话框中,点击 创建 。
实时趋势系列趋势图会在选择的文件夹中创建。
 Real-Time Plotting
 Create Object Dialog – Naming the Object Page
 Create Trend Chart Wizard – Configure Trend Chart Page
 Create Trend Chart Wizard – Configure Real-Time Trend Series Page
