earth_america
user_standard 登录
action_search_stroke
earth_america
登录以评价并提供反馈 1 2 3 4 5 登录以评价
0
如何

如何


产品: AS-L, AS-B, Enterprise Central, Enterprise Server, AS-P, Project Configuration Tool
功能: 趋势
产品版本: 2.0, 2.1, 3.0, 3.1
2019/7/15

编辑或备注趋势日志记录

您可以通过趋势日志列表编辑或注释趋势日志记录,举个例子,纠正已损坏的值或注释特定记录。

注释:
  • 当编辑展开趋势日志记录时,所做更改不会影响连接的趋势日志对应的记录。

显示更多
action_close

​The trend log list numerically displays the records of a trend log or an extended trend log. The records of the trend log can be processed by a calculation method before they are presented in the trend log list.

The trend log list can only display one trend log at a time and must be manually refreshed to display recently recorded values.

 
action_zoom_plus_stroke Trend log list, schematic
图: Trend log list, schematic

You can manually add records to a trend log list for any type of trend log.

Time Zone Modes in a Trend Log List

​In a trend log list, you can present the records of a trend log in different time zones: local time zone, EcoStruxure BMS server time zone, and UTC time zone.

有关更多信息,请参阅 Time Zone Modes in a Trend Log List .

Calculation Methods

​Use a calculation method to process the records of the trend log before presenting them in a trend log list or a trend chart. The original records in the trend log are not affected by the calculation method. The calculation method is applied to the trend log records grouped by a specific time interval.

有关更多信息,请参阅 计算方法 .

Period Timestamps in Trend Charts and Trend Log Lists

When a calculated value for a period is presented, the middle of the period is used as the timestamp.

Example:

The calculated value for the period 8:00-9:00 is stamped 8:30. If there is a value at 9:01, the next period is 9:00-10:00, which is stamped as 9:30. The full period may not have passed yet, but the value can be presented even if parts of the period are in the future.

Temporary Trend Log Lists

​To display a trend log without creating a new trend log list or trend chart, the trend log can be displayed in a temporary list or chart.

有关更多信息,请参阅 Temporary Trend Log Lists .

Floating Point Values NaN, INF, and -INF

In the EcoStruxure Building Operation software, the floating point values “Not a Number”, positive infinity, or negative infinity may be displayed in the Basic property tab, in a trend log list, or a trend chart.

有关更多信息,请参阅 Floating Point Values NaN, INF, and –INF .

编辑趋势日志记录
  1. 在 WorkStation 的 系统树 窗格,选择想要编辑的趋势日志列表。

  2. 选择要编辑的记录,然后点击 编辑/评论趋势日志记录 按钮

     
    action_zoom_plus_stroke

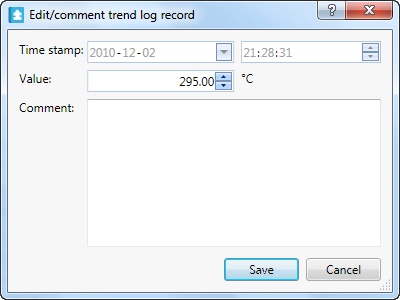
  3. 编辑/注释趋势日志记录 对话框的 框中输入新值。

     
    action_zoom_plus_stroke
  4. 注释 框中,键入注释。

  5. 点击 保存

  6. 在主工具栏中,点击 刷新 按钮

     
    action_zoom_plus_stroke

记录现已被编辑,刷新列表时将显示带有注释的新纪录。所有编辑都被存储,您可以显示记录历史。

  • Displaying the History of a Trend Log Record
  • Trend Log Lists
  • Trend Log List Context Menu
  • Edit/Comment Trend Log Record Dialog Box