Concept
How Trends Work
You use trend logs to record values, such as a sensor. A trend log can also log consumptions, such as energy consumption or water consumption.
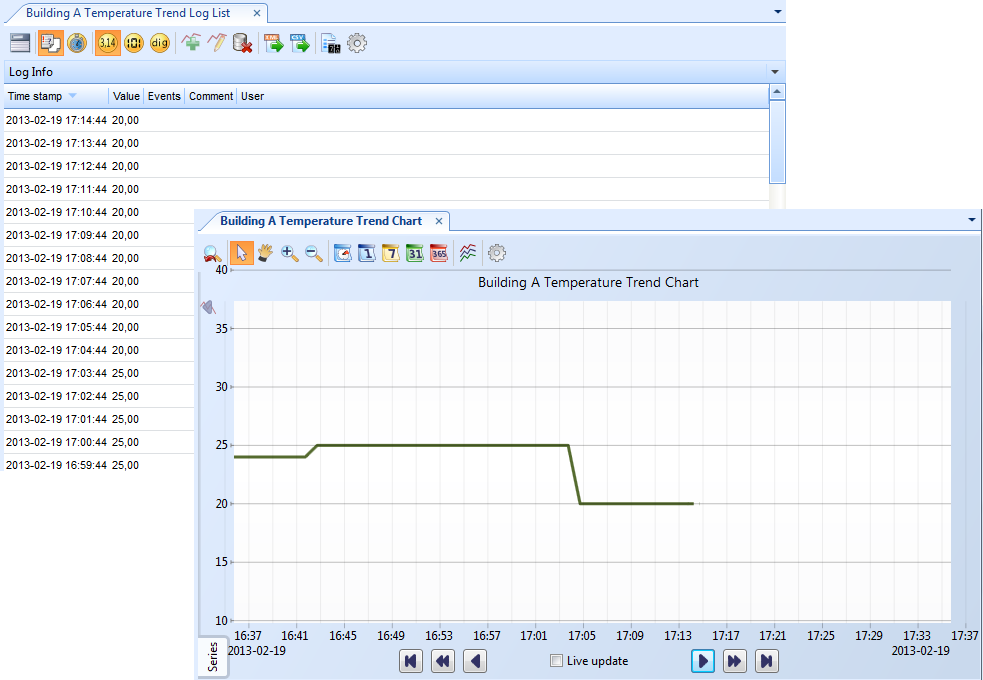
You can view a trend log as a trend log list or as a trend chart.

Trend Charts
Trend charts are a way to graphically present trend logs. A trend chart can contain one or more trend logs that are represented in the trend chart by lines or bars.
For more information, see How Trend Charts Work .
Trend Log Lists in WorkStation
A trend log list displays all values in the trend log in a list.
For more information, see Trend Log Lists in WorkStation .
Trend Log Lists in WebStation
A trend log list displays all values in the trend log in a list.
For more information, see Trend Log Lists in WebStation .
Trend Logs in WebStation
A trend log is a collection of time-stamp values. In WebStation, you can create a trend log from a value.
For more information, see How Trend Logs Work in WebStation .
 WorkStation Overview
 WebStation Overview
 How Trend Charts Work
 Trend Log Lists in WorkStation
 Trend Log Lists in WebStation
 How Trend Logs Work in WebStation
 Trend Logs