User Interface
Series Tab Context Menu
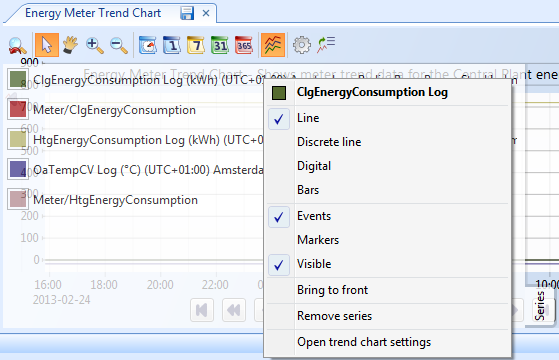
Use the Series tab to open the series context menu, where you can change the presentation of series, show or hide events, markers, and series, bring to front and remove series, as well as open the trend chart settings dialog box.
The series tabs are located at the bottom leftmost if there are series attached to the left y-axis, and at the bottom rightmost if there are series attached to the right y-axis.

|
Component |
Description |
|
Line |
Select to display the series as a line. |
|
Discrete line |
Select to display the series as a discrete line. |
|
Digital |
Select to display the series as a digital line. |
|
Bars |
Select to display the series as bars. |
|
Events |
Select to present the series with event symbols. |
|
Visible |
Select to hide or display the series in the trend chart. |
|
Markers |
Select to display a marker for each record. Markers can only be shown for lines and discrete lines, not for digital and bars. |
|
Bring to front |
Click to display the series in front of the others. |
|
Remove series |
Click to remove series from the trend chart. |
|
Open trend chart settings |
Click to open the property dialog box for the trend chart and its series. |
 Trend Charts
 Trend Chart View
 Trend Chart Event Icons
 Trend Chart Does Not Show Trend Log Series