Interfaz de usuario
Trend Chart Series Properties
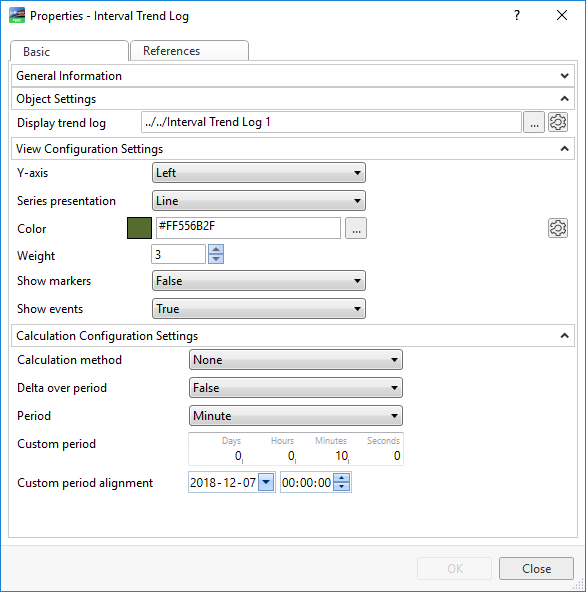
Use the Trend Chart Series Properties dialog box to configure the properties of the trend chart series.

|
Component |
Description |
|
Display trend log |
Displays the path the trend log series is connected to. |
|
Y- axis |
Select Left to attach the series to the left y-axis. |
|
Series presentation |
Select the presentation of the series: line, discrete line, binary, or bars. |
|
Color |
Enter the color of the series. |
|
Weight |
Enter the weight of the line. The line-weight value is a value without correlation to any unit of measure. |
|
Show markers |
Select True to show a marker for each record. The marker can only be shown for lines and discrete lines, not for digital and bars.
|
|
Show events |
Select True to show event symbols in the trend chart.
|
|
Calculation method |
Select the calculation method to calculate the recorded values before displaying the series in the trend chart. |
|
Delta over period |
Select True to apply a period to the delta calculation method. |
|
Period |
Select the time span for which the calculation method is to be executed. |
|
Custom period |
Enter a custom time span for which the calculation method is to be executed |
|
Custom period alignment |
Enter the time when you want the custom period to start. |
 Trend Charts
 Trend Chart Properties
 Trend Series
 General Information Properties – Basic Tab
 References Tab