User Interface
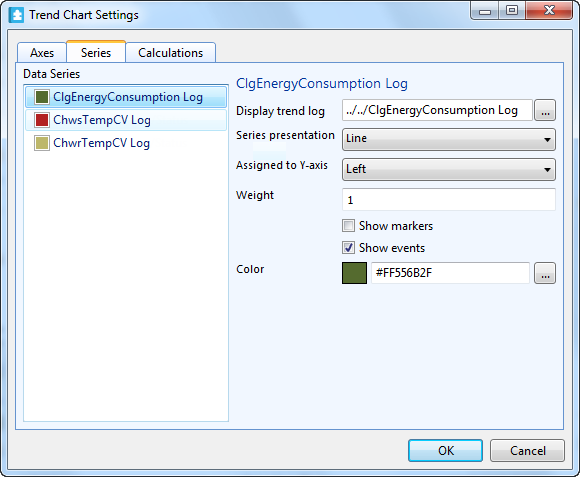
Trend Chart Settings Dialog Box – Series Tab
Use the Series tab to configure the properties of the series in the trend chart.

|
Component |
Description |
|
Display variable/trend log |
Displays the referenced variable or trend log. To change the reference, browse to a different variable or trend log. |
|
Data series |
Displays all series in the trend chart. Select a series to display its presentation properties. |
|
Series presentation |
Select the presentation type of the series. |
|
Assigned to y-axis |
Select Left to attach the series to the left y-axis. |
|
Weight |
Type the weight of the line. The value has no correlation to any unit of measure.
|
|
Show markers |
Select to display a marker for each record. Markers can only be shown for lines and discrete lines, not for digital and bars. |
|
Show events |
Select to present the series with event symbols. |
|
Color |
Enter the color of the series. |
 Trend Charts
 Trend Chart Settings Dialog Box – Axes Tab
 Trend Chart Settings Dialog Box – Calculation Tab