Log on to rate and give feedback
1
2
3
4
5
Log on to rate
0

User Interface
Products:
AS-B, Edge Server, Enterprise Central, Enterprise Server, AS-P, WorkStation, Virtual Project Servers
Functionalities:
Trends
Product version:
2023, 2024
12/17/2022
Trend Chart View
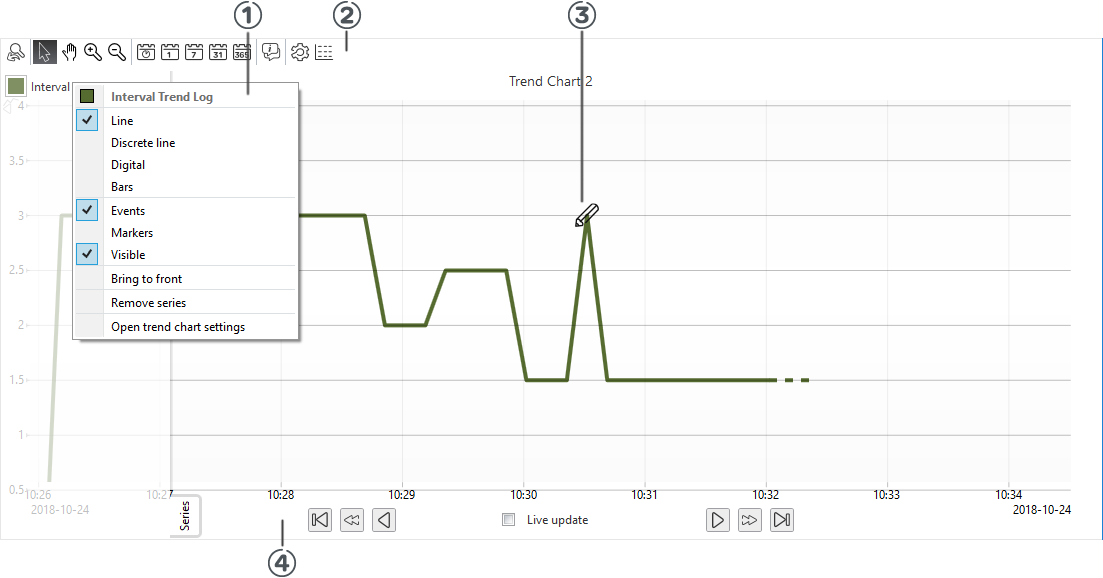
Use the Trend Chart view to graphically display trend log records and events.

Figure:
Trend chart view
|
Number |
Description |
|

|
Use the Series tab shortcut menu to manage the appearance of a trend log series. For more information, see Series Tab Context Menu . |
|

|
Use the trend chart toolbar to adjust the visible trend chart area. For more information, see Trend Chart Toolbar . |
|

|
Use the trend log event icons to get information about a specific record. For more information, see Trend Chart Event Icons . |
|

|
Use the navigation bar to horizontally adjust the visible trend chart area. For more information, see Trend Chart Navigation Bar . |
 Trend Charts
 Trend Chart Toolbar
 Series Tab Context Menu
 Trend Chart Event Icons
 Trend Chart Navigation Bar
 Real-Time Plotting
 Temporary Trend Log Lists
 Trend Chart Y-Axis has Scale Problems
 Trend Chart Live Update does not Work