earth_america
user_standard 登录
action_search_stroke
earth_america
登录以评价并提供反馈 1 2 3 4 5 登录以评价
0
如何

如何


产品: WebStation
功能: 趋势
产品版本: 2.0, 2.1, 3.0, 3.1, 3.2, 3.3, 2022, 2023
2018/7/22

自动配置 Y 轴标度

您可以将趋势图配置为自动配置 Y 轴标度。趋势图具有一左一右两个 Y 轴。您可以使用此步骤设置这两个轴的标度。

显示更多
action_close

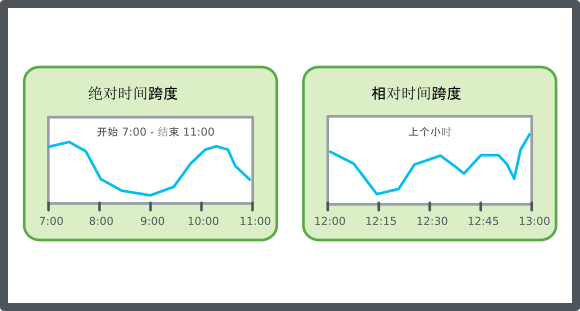
The x-axis of the trend chart represents time. The time span of the axis can be set with a fixed start and end time or with an end time relative to the present time. The axis can be quick-scaled to show the last hour, last day, last month, or last year​.

 
action_zoom_plus_stroke Absolute time span and relative time span, schematic
图: Absolute time span and relative time span, schematic

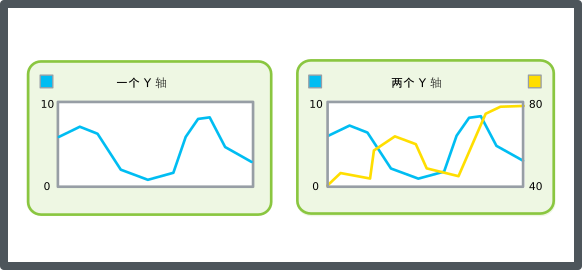
The y-axis refers to the measurement unit that the variable represents. The scale of the y-axis can be set manually or by auto scale. You can configure the trend chart to present series on one y-axis or two y-axes, one to the left and one to the right. Use two y-axes to present series with different ranges in the same trend chart.

 
action_zoom_plus_stroke One y-axis and two y-axes, schematic
图: One y-axis and two y-axes, schematic

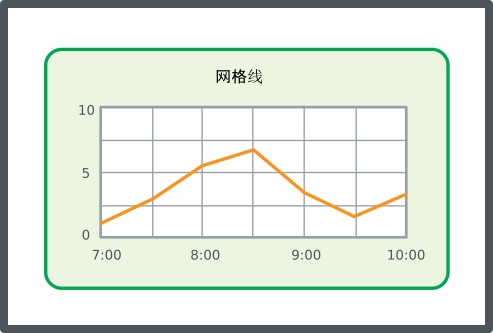
To make reading easier, grid lines can be shown in the trend chart. Grid lines can be shown in both the x- and y-direction, independent of each other.

 
action_zoom_plus_stroke Grid lines, schematic
图: Grid lines, schematic

自动配置 Y 轴标度
  1. 在 WebStation 的 系统树 窗格中,选择想要配置的趋势图。

  2. 趋势图 工具栏,点击 设置 按钮

     
    action_zoom_plus_stroke

  3. 设置 对话框中,点击 左轴 选项卡。

  4. 自动缩放左边 Y 轴 框中,选择 正确

  5. 点击 右轴 选项卡。

  6. 自动缩放右边 Y 轴 框中,选择 正确

  7. 点击 确定

  8. 点击 保存

  • WebStation 中的趋势图轴
  • 通过相对时间跨度配置 X 轴
  • 通过绝对时间跨度配置 X 轴
  • 显示趋势图网格线
  • 手动配置 Y 轴标度
  • 保存当前趋势图设置
  • 趋势图视图
  • 趋势图设置对话框 – 左轴选项卡