
Specifications
WebStation

Introduction
EcoStruxure Building Operation WebStation is a web-based user interface for day-to-day operation in an EcoStruxure BMS. WebStation comes built in with every EcoStruxure BMS server, and provides easy access to the software from anywhere in the world.
Features
WebStation provides a rich, responsive user interface to access the EcoStruxure BMS servers using common web browsers on Windows PCs, Mac OS computers, Android and iOS tablets and smartphones. Users can view and manage dashboards, slide shows, graphics, alarms, schedules, trend logs and user accounts.
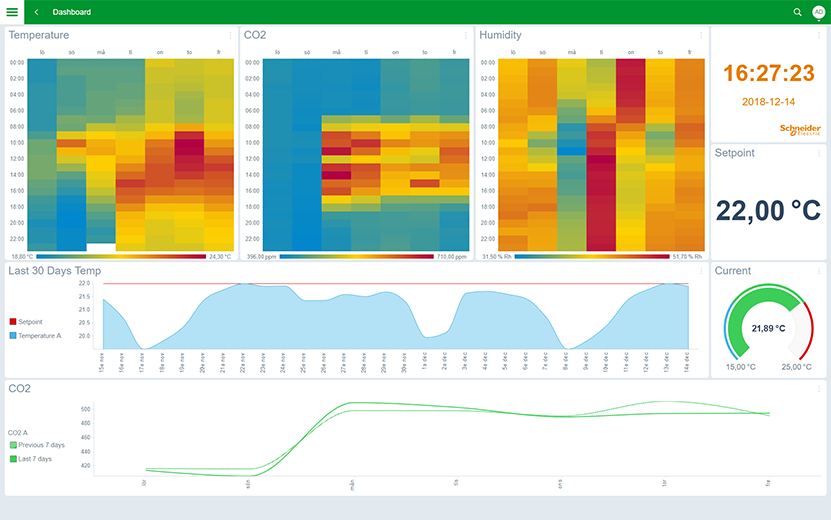
The dashboard functionality enables users to create their own pages to get an overview of how buildings perform, using easy-to-use and easy-to-read data visualization components. Basic energy consumption monitoring, alarm statistics, and environmental summaries are presented in clear ways on any device.
The EcoStruxure Building Operation software has a set of built-in components for visualization of live and historical data, including interactive widgets for alarm and event statistics to help management of alarms. For customers with additional requirements, custom dashboard components can be developed using the powerful graphics capabilities.
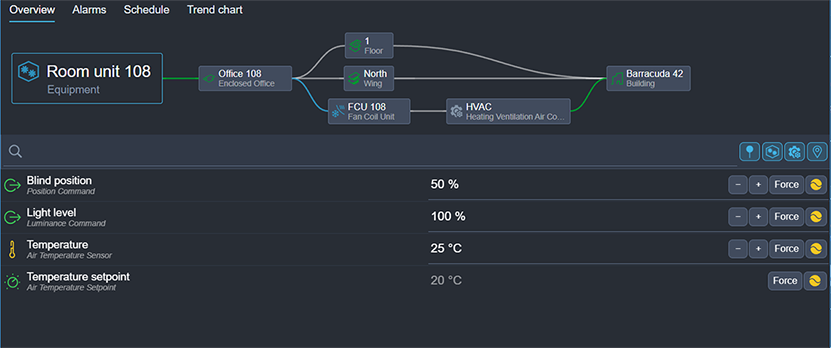
With the support for semantic modelling using Brick Schema in EcoStruxure Building Operation, WorkStation and WebStation provide users with enhanced contextual information. Using Brick Schema, users can easily see where alarms originate from, what areas are affected and where to find root causes. The system can be navigated, searched, and filtered using understandable information about locations, equipment, point types and their relationships. WorkStation and WebStation also provide automatically generated alarm views, trend charts and schedule views for the modelled entities. For example, when selecting a floor in a building, the system automatically provides an alarm view filtered for alarms that originate from sources that are related to that floor.
With the meter management functionality, EcoStruxure Building Operation offers improved methods to ensure data is accurate and meter changes are automatically detected. In addition, purpose-built functions enable easier handling of the following concepts:
Aggregations
Virtual metering
Apportioned metering
Unit conversions
Meter hierarchies enable powerful visualization of sub-meter structures or categorizations. A web-based editor with intelligent help functions enables efficient construction of meter hierarchies.
The normalization functions help with benchmarking, and the signature function enables automation and/or alerting when resource usage is too high or low. This enables early detection of faulty equipment and misused building functions, resulting in energy savings and higher occupant satisfaction.
The system includes easy-to-use tools for regression analysis and powerful methods for time-period classification, that is, differentiation of workdays versus holidays.
Using the built-in security features within the EcoStruxure Building Operation software, you can comply with 21 CFR Part 11 and other Life Sciences regulations, restricting access to authorized and qualified individuals and with full audit trail. In addition, the built-in access and security settings can be enhanced by applying further restrictions and limit access by time-of-day or geographic location.
The change control features extend the basic activity logging provided by the EcoStruxure Building Operation software by enhancing the functionality of the standard log, enabling efficient and fully configurable change control with the following features:
Single or dual electronic signature application
Change control that can be restricted only to specific objects in the system
Change control that can easily be applied to all objects
Every associated action is logged with the parameter that was changed
Before and after parameter values including meta data
For each signature event, the change control signatures contain:
The unique identifier of the person executing the signature
The full name of the user who performed the action
The geographical date and time stamp
The meaning of the signature, such as approval, review, responsibility, and authorship
For public displays, the slide show can automatically switch between dashboards to provide up-to-date information for building occupants.
An EcoStruxure BMS requires each user to have an account. Access can be through an account maintained by the EcoStruxure Building Operation database or through a Windows Active Directory account. IT policies for password formatting, aging, and uniqueness are supported and enforced. Access rights can be assigned based on schedule and/or client IP address.
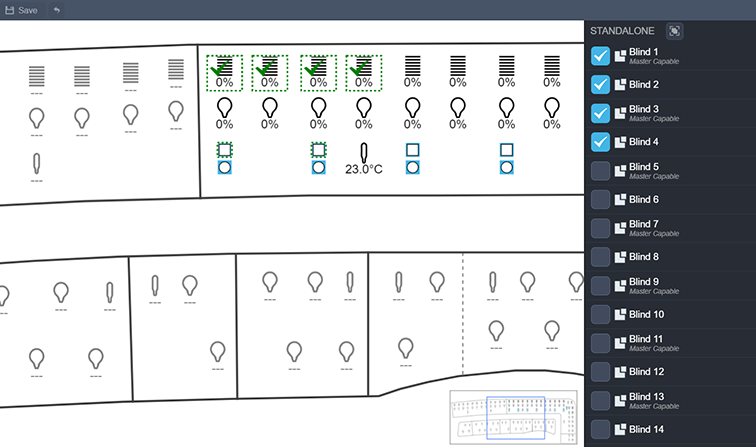
WebStation allows for very easy re-configuration of Connected Room Solutions functionality through the optional Zoning add-on license. Graphical or tabular views enable quick editing of how HVAC, blinds and lighting are synchronized within or across room controllers from any web browser device.
The software adapts the displayed language, measurement system, and date/time format to the operating system settings. Language and measurement system can easily be switched from within WebStation. Translations of WebStation are delivered as separate language packs that are easy to install and deploy. More than 40 preset data and time formats are supported. Administrators can configure localization defaults to save end users from having to edit the regional settings.
The software has the flexibility to be fully customized to the viewing preference of each user. In the main interface, called the Workspace, users can select a wide variety of components, such as custom menus, alarms, graphics, and editors. WebStation supports Workspace and Panel functionality without modification and automatically adapts the layout to the device used.
The search function helps users quickly find information and navigate to wherever they need to go. By typing in all or part of the name, the user sees a list of all items that match. The software shows the current status or value for each item and users can open the item directly from the search list.
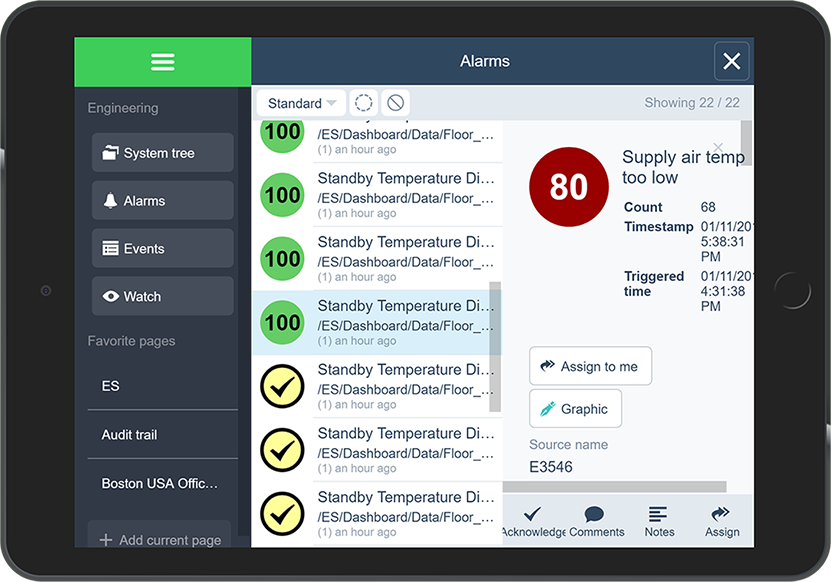
Alarms need to be assessed and responded to quickly. Through WebStation, alarms are displayed in a simple and efficient way to ensure that no alarm is overlooked. Alarms can be color coded, grouped, and filtered for maximum efficiency. WebStation enables dispatch centers or managers to assign alarms to a user or a group of users. Using a filter, users can see only the alarms assigned to them and accept or reject the assignment.
Filter settings and layout can be edited and stored as Favorites in the Alarms view and the Events view. Quick filter enables fast filtering of the views. Multiple alarms can be batch acknowledged for effective alarm management.
Alarms can be acknowledged with varying degrees of detail, depending on the importance of the alarm. Users can be required to enter notes or choose from a standard list to explain how the issue was resolved. WebStation can present the user with instructions or a specific view of their system that shows details of the affected equipment. The audit trail records the user’s actions.
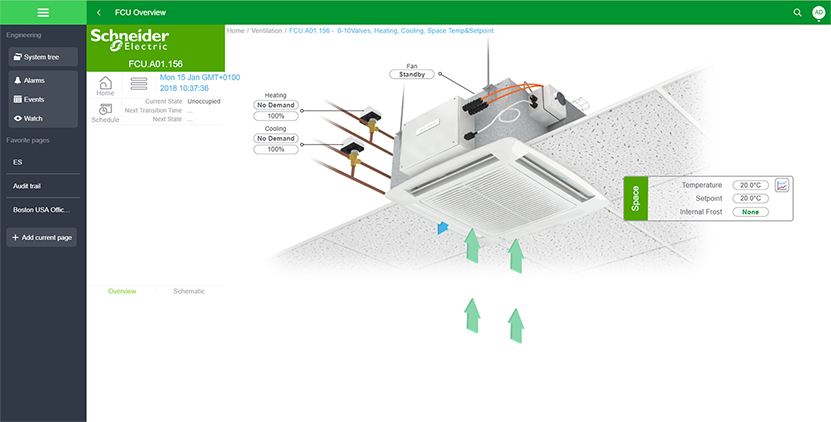
In an EcoStruxure BMS, the graphics can be customized to provide the user interface required to effectively run each facility. Graphics are stored locally in the EcoStruxure BMS servers and are available to authorized users from wherever they log on.
The EcoStruxure Building Operation software uses scalable vector graphic technology so that users can zoom in to see details without losing clarity. Graphics are built once, but can be used on any display regardless of size or resolution. Vector graphic file sizes are small so they can be stored and served directly from the SpaceLogic automation server.
A standard live update simply shows the displayed values as conditions change in the field. With the EcoStruxure Building Operation software's super dynamic live updates, all aspects of graphical elements can change when values change.
It is important to log more than basic activity. The software logs every action with a timestamp, the user who performed the action, and the values that were changed.
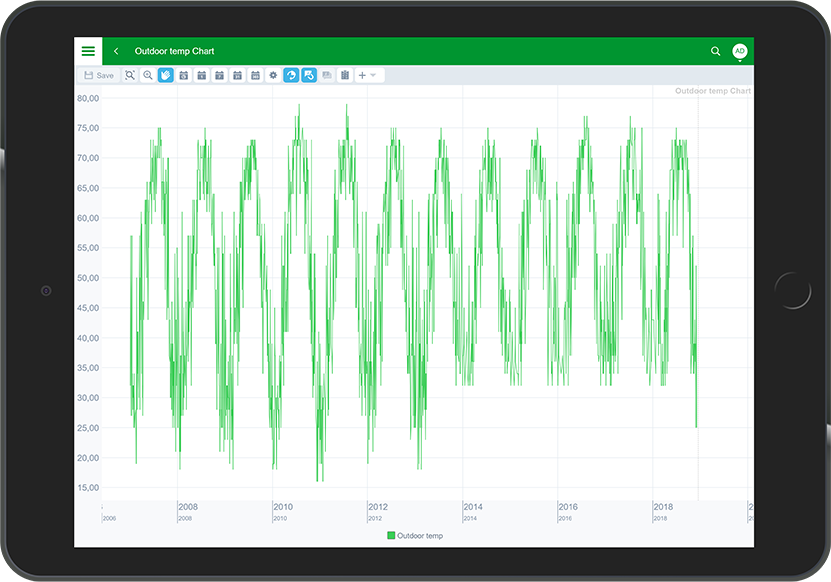
The software can trend data in many ways, including a periodic method (every day, hour, minute) and a change-of-value (COV) method that only records when a defined threshold has been passed. These trend logs can be shown in trend lists and charts to visualize patterns for diagnostic and optimization purposes. Multiple series can be presented in a single chart, so that data points can be easily compared.
The color, weight, and style of all lines can be specified. Display of digital data is automatically shown as high and low horizontal bars, eliminating the need for additional scaling. Log data can be presented as average, minimum, maximum, or delta in addition to the actual log value itself. Users can zoom in to see details without losing clarity. A trend chart can have two different scales on the same chart to see how different data relate to each other.
Trend data can be exported and downloaded as Excel files.
WebStation is based on standard web technologies and requires no special configuration on the client or server side. Platform-independent technologies make it run on most popular browsers. No Schneider Electric specific software has to be installed and maintained on the client computers and no browser plug-ins are needed.
Communication between clients and the EcoStruxure BMS servers can be encrypted using Transport Layer Security (TLS) . The servers are delivered with a default self-signed certificate. Commercial Certification Authority (CA) server certificates are supported to lower the risk of malicious information technology attacks. Use of encrypted communication can be enforced for both WorkStation and WebStation access.
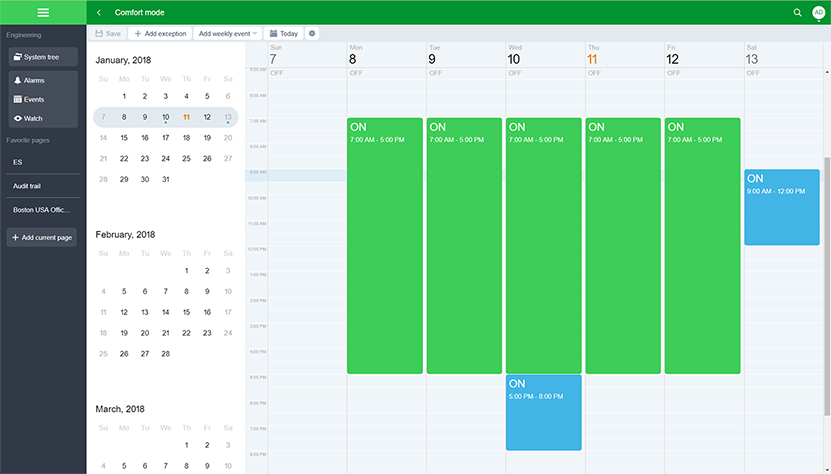
Energy efficiency is achieved when equipment is running only when necessary. Schedules manage that process through a graphical interface that is easy-to-use. Change times with a few simple clicks of the mouse. The powerful Schedule Editor can set up recurring events (every Monday, every third Tuesday, or every January 1st) or an unlimited number of exceptions with priority levels. Schedules go beyond the basic on and off control by enabling direct control of analog values. For example, users can set schedule events to percentages to control lighting levels without writing a program.
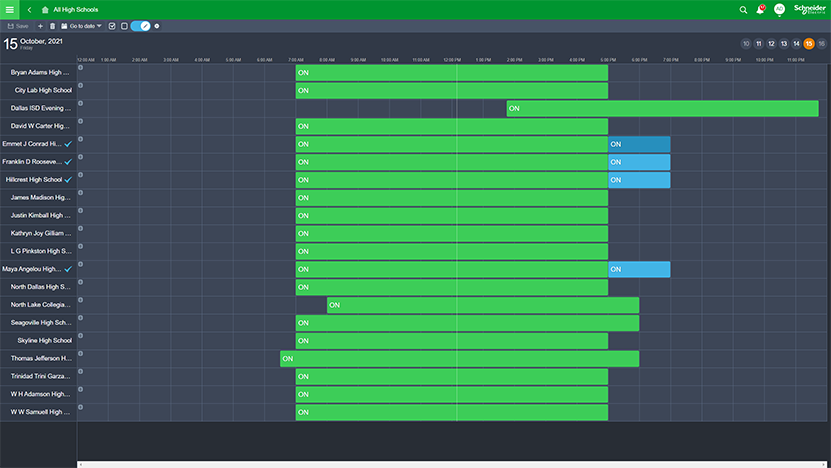
WebStation also provides a powerful combined view of multiple schedules, which allows simple editing of many schedules in a single operation.
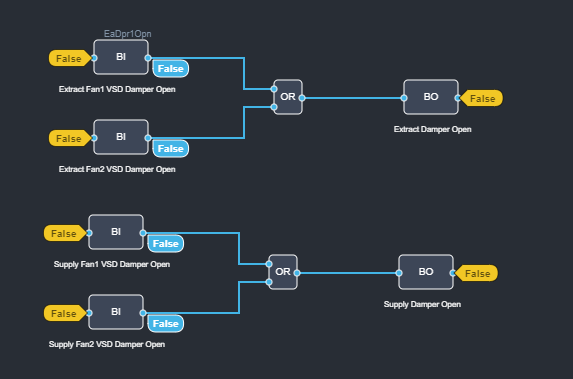
WebStation offers a built-in, quick and easy way to view the contents of Function Block programs, allowing users to get a more detailed view of the program logic, including a live view of inputs, outputs, and other values.
Specifications
| Server side | |
| See the SpaceLogic AS-P server, SpaceLogic AS-B server, Edge Server, Enterprise Server, and Enterprise Central specification sheets. | |
| Client-side hardware | |
Display
|
Minimum: 320x568 pixel resolution
|
Recommended: 1,024x768 pixel resolution, portrait and landscape mode
|
|
Other devices
|
A pointing device such as a mouse or touchscreen.
|
| Client-side software | |
| Web browser support | |
Minimum web browser versions required
|
Google Chrome 119 and later
|
Mozilla Firefox 119 and later
|
|
Microsoft Edge 119 and later
|
|
Safari 14 and later
|
|
Recommended web browser versions
|
Google Chrome latest
|
Mozilla Firefox latest
|
|
Microsoft Edge latest
|
|
Safari latest
|
|
| Communication (to EcoStruxure BMS servers) | |
HTTP
|
Non-binary, port configurable, default 80
|
HTTPS
|
Encrypted supporting TLS 1.3, port configurable, default 443
|


 Building Operation WebStation Overview
 SpaceLogic AS-P
 SpaceLogic AS-B
 Enterprise Server
 Enterprise Central
 Edge Server