Log on to rate and give feedback
1
2
3
4
5
Log on to rate
0

How to
Products:
Enterprise Central, Enterprise Server, Esmi Sense FDP, WorkStation
Functionalities:
Trends
12/2/2024
Manually Configuring the Y-Axis Scale
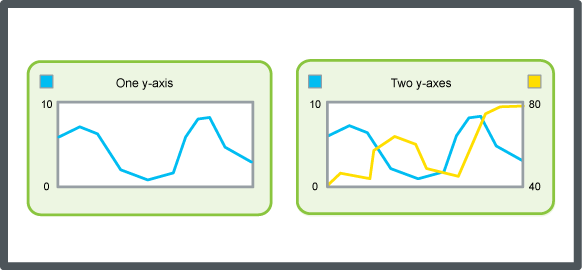
You manually configure the trend chart y-axis to have a fixed scale. The trend chart has two y-axes, one to the left and one to the right. You can use this procedure to scale both axes.
To manually configure the y-axis scale
In WorkStation, in the System Tree pane, select the trend chart you want to configure.
On the Trend Chart toolbar, click the Open trend chart settings button
.action_zoom_plus_stroke 
In the Trend chart settings dialog box, clear Auto scale left y-axis and Auto scale right y-axis .
In the Left y-axis minimum and Right y-axis minimum boxes, type the minimum value of the y-axis.
In the Left y-axis maximum and Right y-axis maximum boxes, type the maximum value of the y-axis.
Click OK .
The y-axis is now set with a fixed scale.
 Trend Chart Axes
 Automatically Configuring the Y-Axis Scale
 Assigning a Series to a Y-Axis
 Trend Chart Event Icons
 Trend Chart Settings Dialog Box – Axes Tab
 Trend Chart Does Not Show Trend Log Series


