Interface utilisateur
Trend Chart Settings Dialog Box – Right Axis Tab
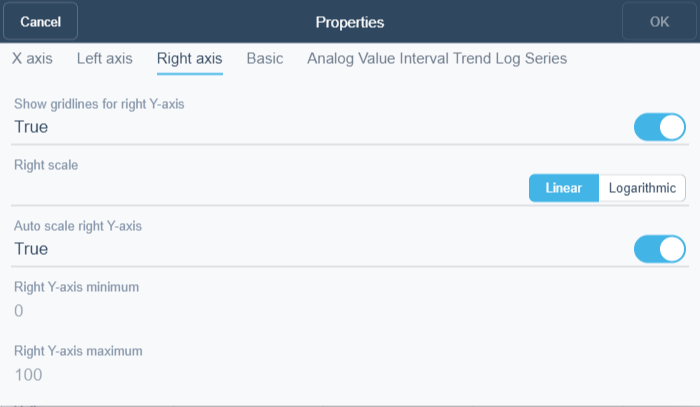
Use the Right axis tab in WebStation to change the settings for the right axis of a trend chart.

|
Component |
Description |
|
Show gridlines for right Y-axis |
Select True to show grid lines originating from the right y-axis scale. Pour plus d'informations, voir Showing Trend Chart Grid Lines . |
|
Right scale |
Select if you want to display the axis linear or logarithmic. |
|
Auto scale right Y-axis |
Select True to activate auto scale. The scale of the right axis automatically adapts to the displayed series. Pour plus d'informations, voir Automatically Configuring the Y-axis Scale . Clear to deactivate auto scale. Manually scale the left axis by typing values in the Right Y-axis minimum and Right Y-axis maximum boxes |
|
Right Y-axis minimum |
Type the minimum value of the right y-axis. Pour plus d'informations, voir Manually Configuring the Y-Axis Scale . |
|
Right Y-axis maximum |
Type the maximum value of the right y-axis. Pour plus d'informations, voir Manually Configuring the Y-Axis Scale . |
 Trend Chart Series in WebStation
 Trend Series
 Menu Série de la courbe de tendance
 Trend Chart Settings Dialog Box – X Axis Tab
 Trend Chart Settings Dialog Box – Series Tab