User Interface
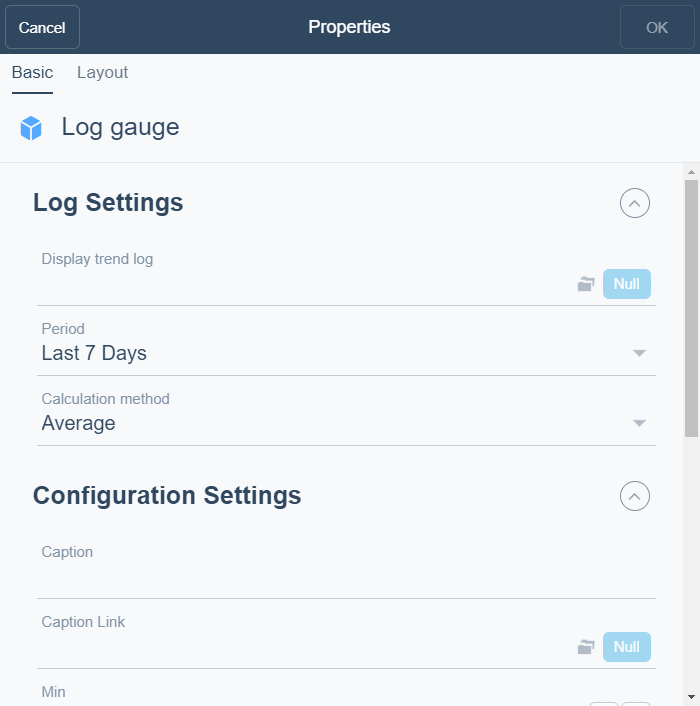
Log Gauge Properties Dialog Box
Use the Log Gauge Properties dialog box to configure and edit a log gauge.

|
Component |
Description |
|
Display trend log |
Enter the trend log you want to display. |
|
Period |
Select the period you want to display. |
|
Calculation method |
Select the calculation method for the trend log. For more information, see Calculation Methods . |
|
Caption |
Type a caption for the widget. |
|
Caption Link |
Select to make a link to an object that is relevant to the values that are displayed in the widget. |
|
Min |
Enter the minimum value for the gauge. |
|
Max |
Enter the maximum value for the gauge. |
|
Guides |
Use the guides to define the colors for different values and value ranges. For more information, see Log Gauge . |
|
Add |
Click to add a guide to define the colors for different values and value ranges. For more information, see Log Gauge . |
|
Value |
Select a value for the guide in the widget. |
|
Color |
Select a color for the value for the guide in the widget. |
|
Description |
Type a description. |
|
Indicator color |
Select the indicator color for the needle or the indicator in the gauge. For more information, see Log Gauge . |
|
Decimals |
Select the number of decimals you want to display. |
|
Show Period |
Select to display the period as a legend. |
|
Use needle |
Select True to use a needle as indicator in the gauge. If no needle is selected the gauge displays the value as an indicator instead. |
 Dashboard Widgets
 Log Gauge
 Widget Dialog Box – Layout Tab