Benutzeroberfläche
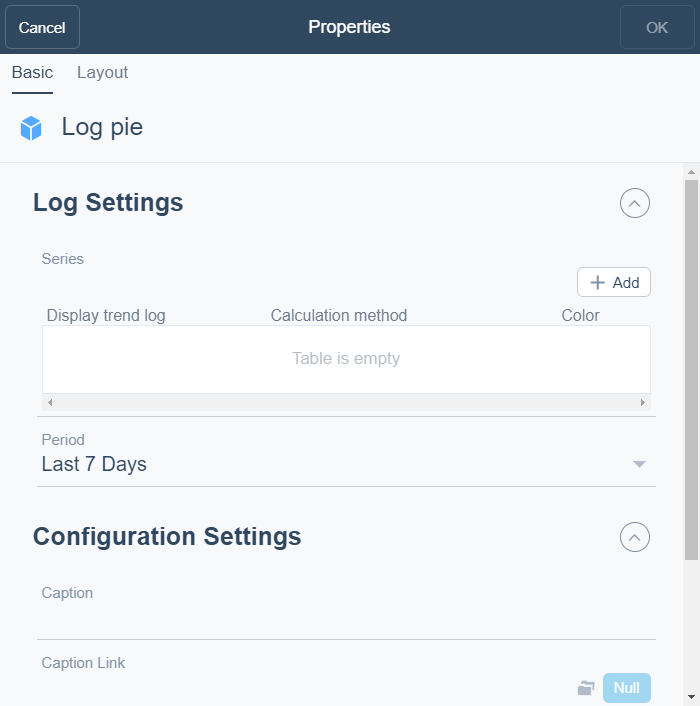
Eigenschaften-Dialogfeld Protokoll-Kreisdiagramm
Verwenden Sie das Dialogfeld Log-Kreisausschnitt-Eigenschaften , um einen Log-Kreisausschnitt zu konfigurieren und zu bearbeiten.

|
Komponente |
Beschreibung |
|
Hinzufügen |
Click to add a trend log. |
|
Trendlog |
Enter the trend log you want to display. |
|
Berechnungsmethode |
Select the calculation method for the trend log. Für weitere Informationen siehe Calculation Methods . |
|
Farbe |
Übernehmen die Farbe für den Trendlog. |
|
Zeitraum |
Select the period you want to display. |
|
Beschriftung |
Type a caption for the widget. |
|
Beschriftungsverknüpfung |
Select to make a link to an object that is relevant to the values that are displayed in the widget. |
|
Kreisausschnittmitte |
Select how you want to display the pie center. Für weitere Informationen siehe Log-Kreisausschnitt . |
|
Legende anzeigen |
Click True to display the name and color of the trend log in the widget. |
|
Prozentwert anzeigen |
Select to display the values in percentage. |
|
Zeitspanne anzeigen |
Select to display the period as a legend. |
 Dashboard-Widgets
 Log-Kreisausschnitt
 Dialogfeld Widget – Registerkarte Layout