Interfaz de usuario
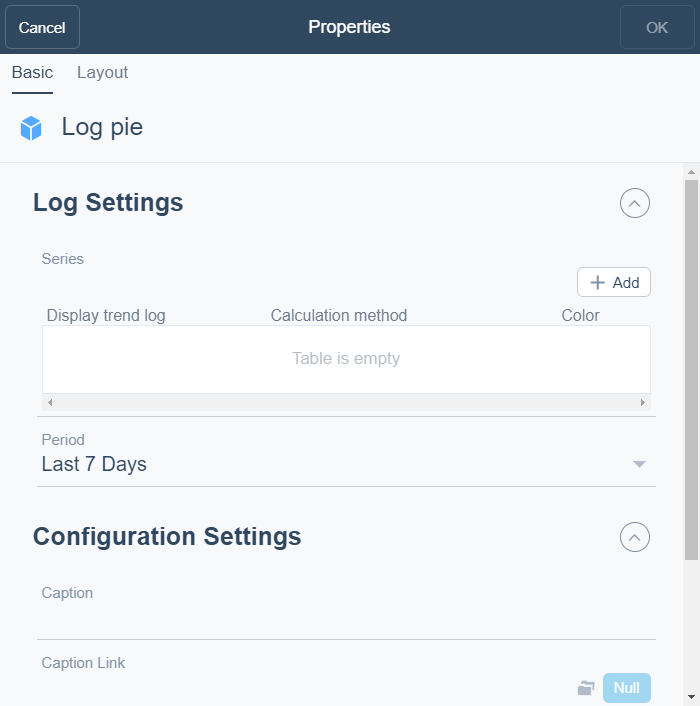
Cuadro de diálogo Propiedades de gráfico circular de registro
Utilice el cuadro de diálogo Propiedades de gráfico circular de registro para configurar y editar un gráfico circular de registro.

|
Componente |
Descripción |
|
Añadir |
Click to add a trend log. |
|
Mostrar registro de tendencias |
Enter the trend log you want to display. |
|
Método de cálculo |
Select the calculation method for the trend log. Para obtener más información, consulte Calculation Methods . |
|
Color |
Seleccione el color que desea usar para el registro de tendencias. |
|
Periodo |
Select the period you want to display. |
|
Leyenda |
Type a caption for the widget. |
|
Enlace de imagen |
Select to make a link to an object that is relevant to the values that are displayed in the widget. |
|
Centro del gráfico circular |
Select how you want to display the pie center. Para obtener más información, consulte Gráfico circular de registro . |
|
Mostrar leyenda |
Click True to display the name and color of the trend log in the widget. |
|
Mostrar porcentaje |
Select to display the values in percentage. |
|
Mostrar periodo |
Select to display the period as a legend. |
 Widgets de panel
 Gráfico circular de registro
 Cuadro de diálogo del widget – Pestaña de diseño