Interface utilisateur
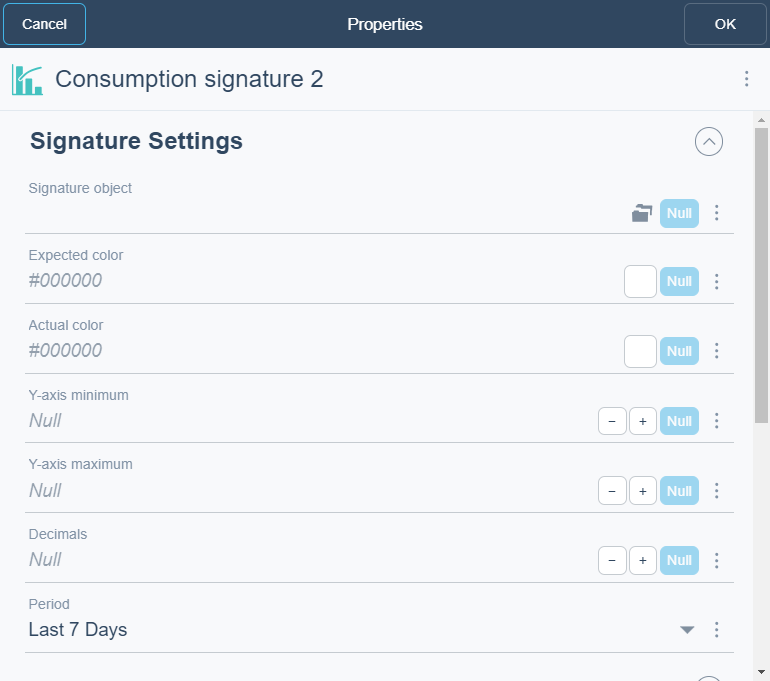
Boîte de dialogue Widget de signature de consommation
Utilisez la boîte de dialogue Widget de signature de consommation pour configurer et modifier une signature de consommation.

|
Composante |
Description |
|
Objet signature |
Select the column(s) you want to display in the widget. |
|
Couleur attendue |
Select the filter you want to apply. |
|
Couleur réelle |
Enter the number of bars you want to display in the chart. |
|
Minimum sur l'axe Y |
Enter the Y-axis minimum. |
|
Maximum sur l'axe Y |
Enter the Y-axis maximum. |
|
Décimales |
Select the number of decimals you want to display. |
|
Période |
Select the period you want to display.
|
|
Légende |
Type a caption for the widget. |
|
Lien de légende |
Select to make a link to an object that is relevant to the values that are displayed in the widget. |
|
Afficher la légende |
Click True to display the name and color of the trend log in the widget.
|
|
Afficher les limites d'alarme |
Click True to show alarm limits. |
|
Afficher la grille |
Click True to show gridlines. |
|
Afficher la période |
Click True to show period. |
 How Dashboards Work
 Widgets de tableau de bord
 Widget Dialog Box – Layout Tab