登录以评价并提供反馈
1
2
3
4
5
登录以评价
0

用户界面
产品:
AS-B, Edge Server, Enterprise Central, Enterprise Server, AS-P, Project Configuration Tool
功能:
时间表
产品版本:
2023
2022/12/17
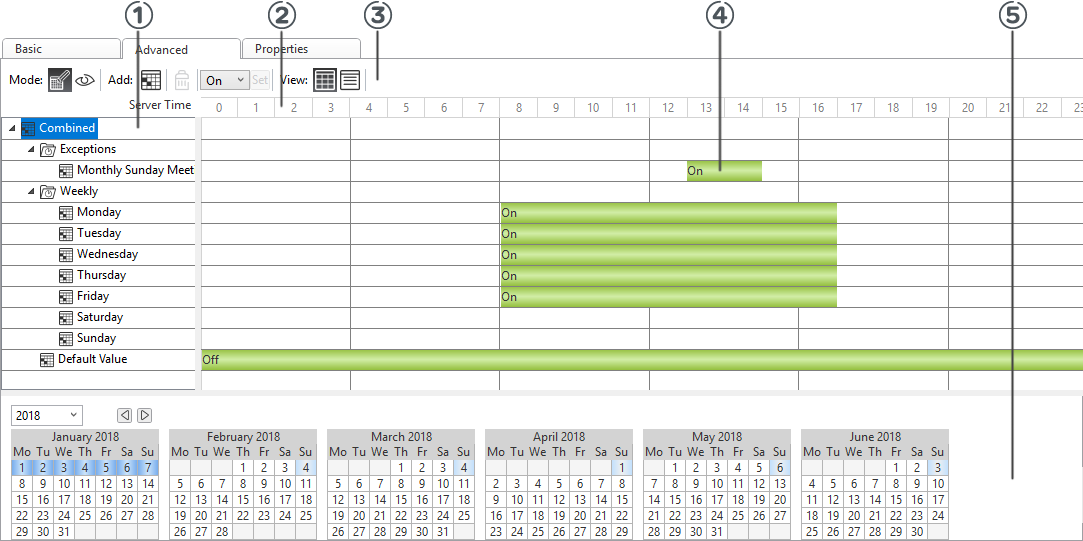
Advanced Schedule Editor – Graphic View
Use the Graphic view to graphically display the scheduled events.

图:
Advanced Schedule Editor – Graphic View
|
Number |
Description |
|

|
Schedule event tree Displays weekly and exception events. |
|

|
Client and server time bar Displays the client time and the EcoStruxure BMS server time. |
|

|
Advanced view toolbar Click the buttons to manage schedules. 有关更多信息,请参阅 Advanced Schedule Editor Toolbar . |
|

|
Time value periods Displays the beginning and end times and the values associated with the scheduled events. |
|

|
Calendar overview Displays in blue the dates that contain exception events. |
 Advanced View of the Schedule Editor
 Advanced Schedule Editor Toolbar