How to
Attaching a Calculation Method to a Trend Chart Series
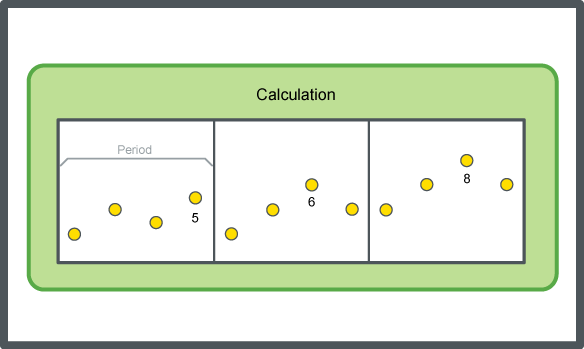
You attach a calculation method to a trend chart series to process the recorded values and present the result.
In WorkStation, in the System Tree pane, select the trend chart you want to attach a calculation method to.
On the Trend Chart toolbar, click Open trend chart settings button
.action_zoom_plus_stroke 
In the Trend Chart Settings dialog box, click the Calculations tab.
In the Data series box, select the series you want to add a calculation method to.
In the Calculation method box, select a calculation method.
Select Delta over period if the calculation method is a delta calculation with periods.
In the Period box, select the time span for which the calculation method is to be executed.
Note:If Custom is selected in the Period box, enter a custom time span for which the calculation method is to be executed in the Custom period box and the time when you want the custom period to start in the Custom period alignment boxes.
To calculate the required number of records for a trend log, multiply the number of records in one day with the number of days you want the trend log to record. For example, the interval of the trend log is set to 1 hour, then this gives 24 recorded values per day. The trend log should record at least one month of recorded values equal to 31 days. For example, the number of records = 24 x 31 = 744.
In the Custom period box, enter a custom time span for which the calculation method is to be executed.
In the Custom period alignment boxes, enter the time when you want the custom period to start.
Click OK .
A calculation method is now attached to the series.
 Calculation Methods
 Trend Chart Settings Dialog Box – Calculation Tab
 Meter Trend Log Calculation Fails


