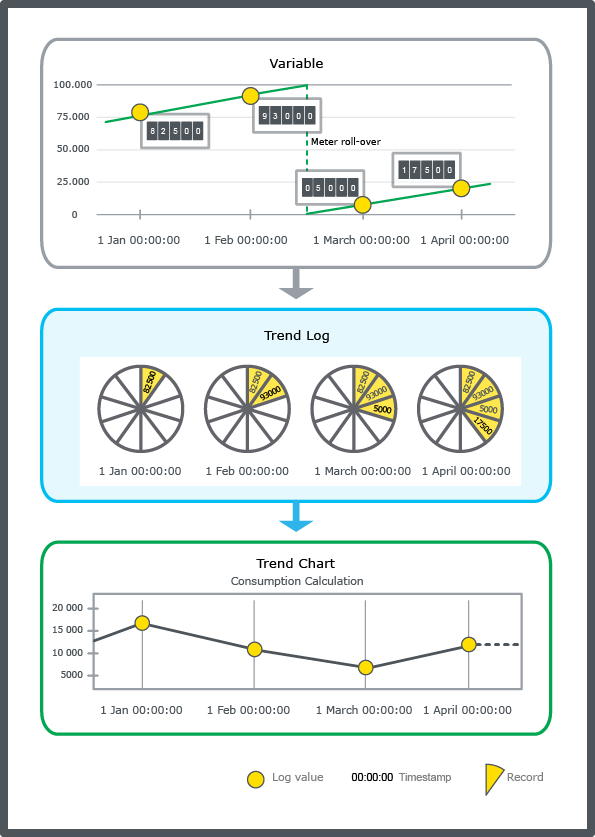
Explicación de procesos
Creating a Meter Trend Log and Associated Objects
You use the meter trend log to record the value of a meter and handle consumption calculations independent of meter rollover and meter exchange.
In WorkStation, in the System Tree pane, select the folder or SmartStruxure server where you want to create the trend log.
On the File menu, point to New and then click Trend .
In the object type list, select Meter Trend Log .
action_zoom_plus_stroke 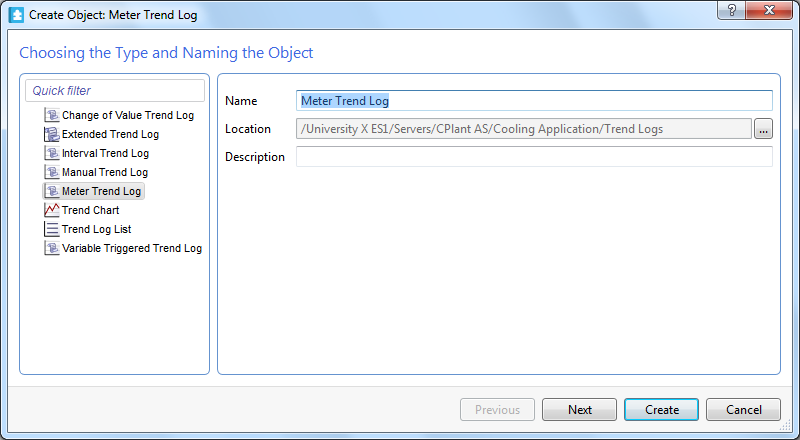
In the Name box, type a name for the trend log.
In the Description box, type a description for the trend log.
action_zoom_plus_stroke 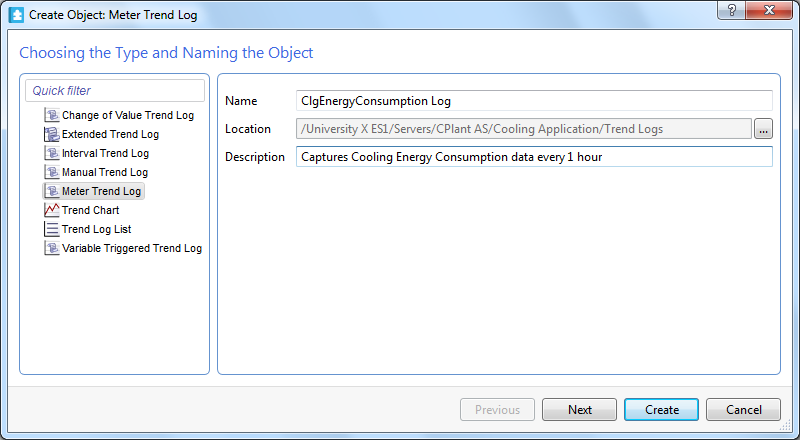
Click Next .
In the Logged variable box, enter the variable that you want to log.
action_zoom_plus_stroke 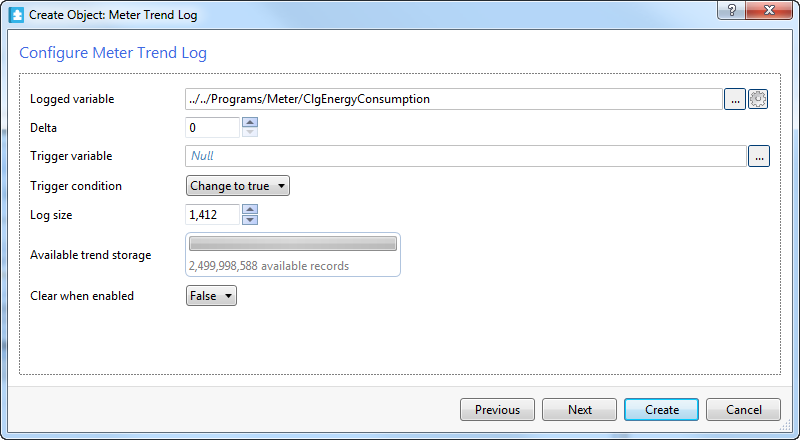
Click the Set unit button
.action_zoom_plus_stroke 
Select a unit for the trend log values.
action_zoom_plus_stroke 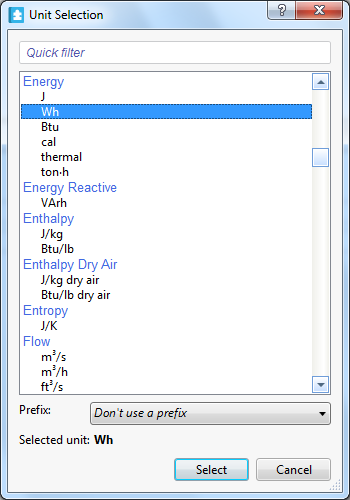
In the Prefix box, select the prefix of the unit.
Click Select .
In the Delta box, enter the minimum value change that triggers a new record.
In the Trigger variable box, enter the variable that triggers the log.
In the Trigger condition box, select when to record the value of the logged variable:
Select Change to true to record the value of the logged variable when the trigger variable changes to true.
Select Change to false to record the value of the logged variable when the trigger variable changes to false.
Select All changes to record the value of the logged variable anytime the trigger variable changes state.
In the Log size box, enter the number of records to be recorded before old records are overwritten.
In the Available trend storage box, check that the available number of records is not exceeded.
In the Clear when enabled box, select True to clear the trend log every time the trend log is enabled.
Click Next .
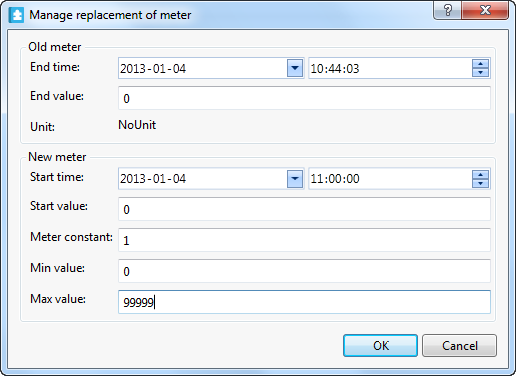
In the Start time box, enter the time when the meter is installed.
action_zoom_plus_stroke 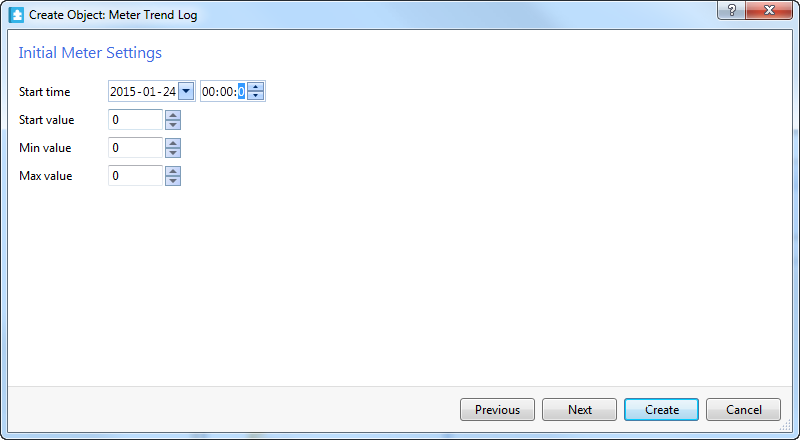
In the Start value box, enter the value of the meter when it was installed.
In the Min value box, enter the first value of the meter when it rolls over.
In the Max value box, enter the last value of the meter before it rolls over.
action_zoom_plus_stroke 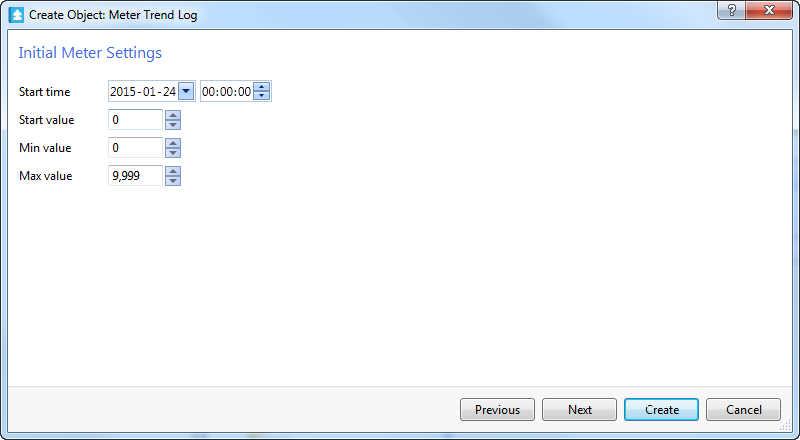
Click Next .
In the Extended Trend Log box, click the Browse button
to create an extended trend log and connect it to the trend log.action_zoom_plus_stroke 
action_zoom_plus_stroke 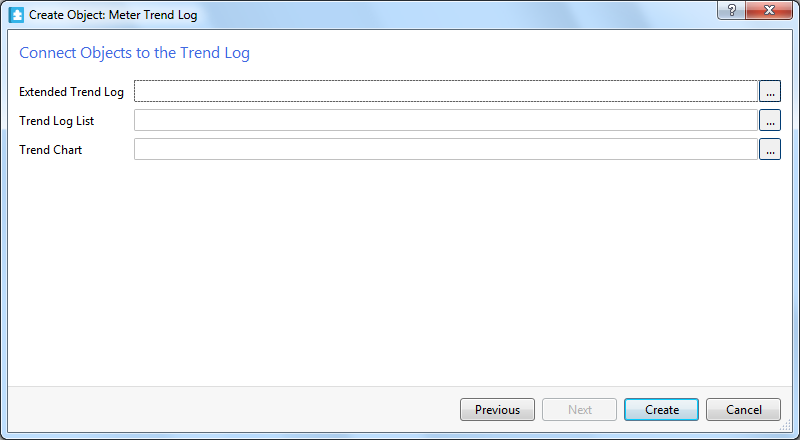
Click Create .
action_zoom_plus_stroke 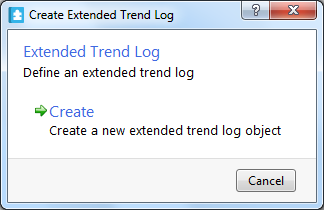
In the Name box, type a name for the extended trend log.
action_zoom_plus_stroke 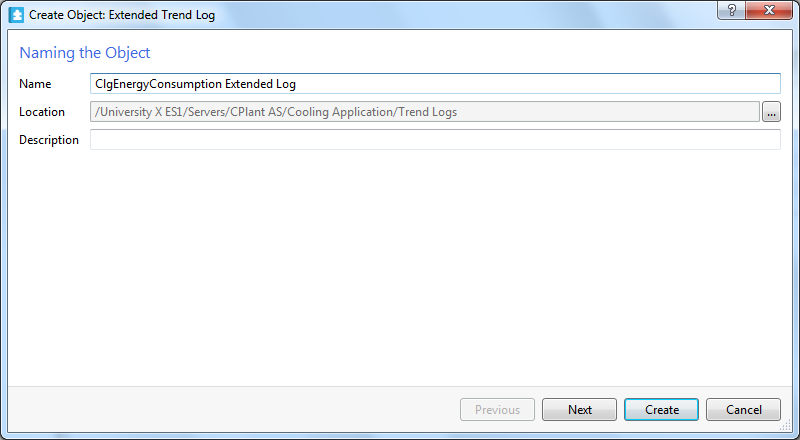
In the Location box, enter the path where to store the extended trend log.
In the Description box, type a description for the extended trend log.
action_zoom_plus_stroke 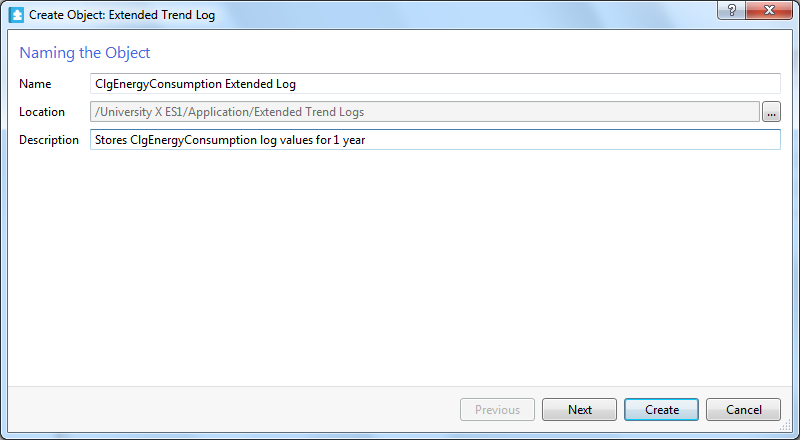
Click Next .
In the Monitored trend log box, make sure that the meter log is entered.
action_zoom_plus_stroke 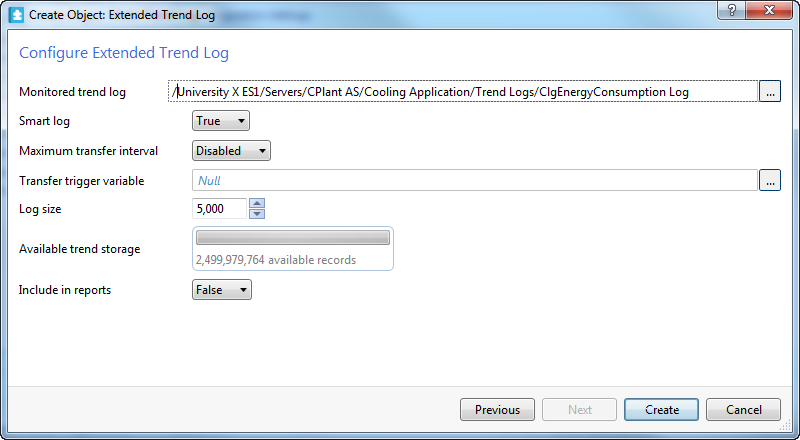
In the Smart log box, select if you want to use smart log:
Select True to enable Building Operation software to automatically optimize the transfer rate of records from the monitored trend log to the extended trend log.
Select False to manually specify the percentage threshold at which the trend log transfers its records to the extended trend log, and then select the percentage in the Threshold box.
In the Maximum transfer interval box, select the maximum length of time that can pass between transfers.
In the Transfer trigger variable box, enter a trigger variable to force a transfer of all records from the trend log to the extended trend log, for example, to generate a complete report. Para obtener más información, consulte Extended Trend Logs .
In the Log size box, enter the number of records to be stored before old records are overwritten.
In the Available trend storage box, check that the available number of records is not exceeded.
In the Include in reports box, select True to make the extended trend log available to WebReports, for example, to include the extended trend log in a trend log comparison report.
Click Create .
action_zoom_plus_stroke 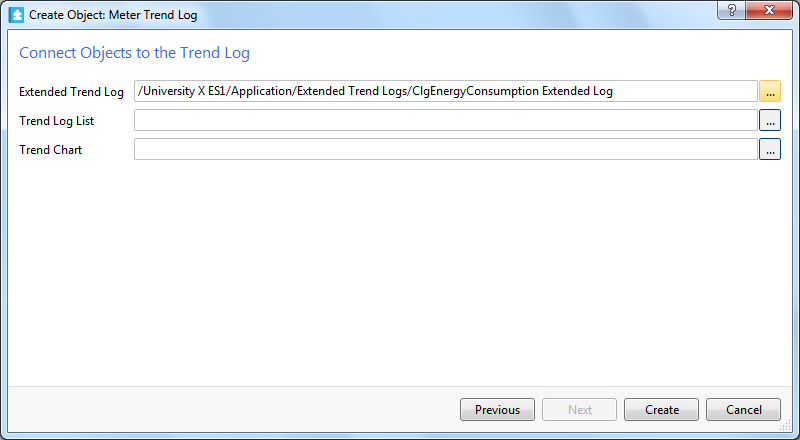
In the Trend Log List box, click the browse button
to create a trend log list and connect it to the trend log.action_zoom_plus_stroke 
Click Create .
action_zoom_plus_stroke 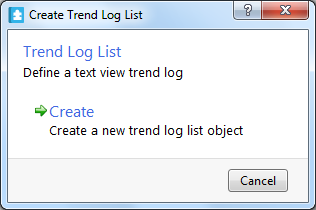
In the Name box, type a name for the trend log list.
action_zoom_plus_stroke 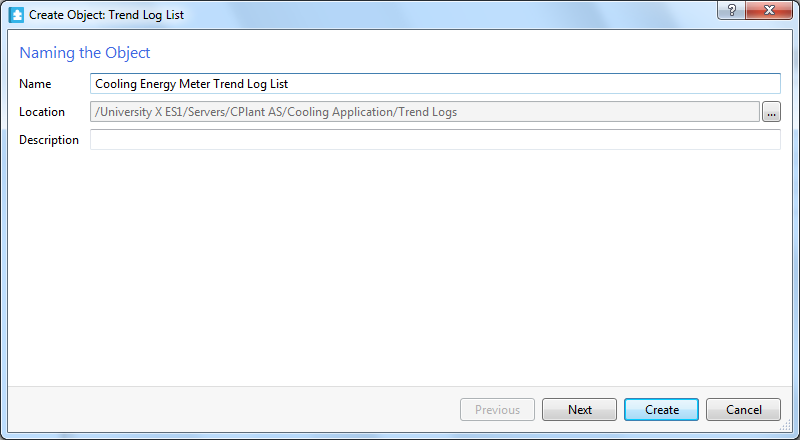
In the Location box, enter the path where to store the trend log list.
In the Description box, type a description for the trend log list.
action_zoom_plus_stroke 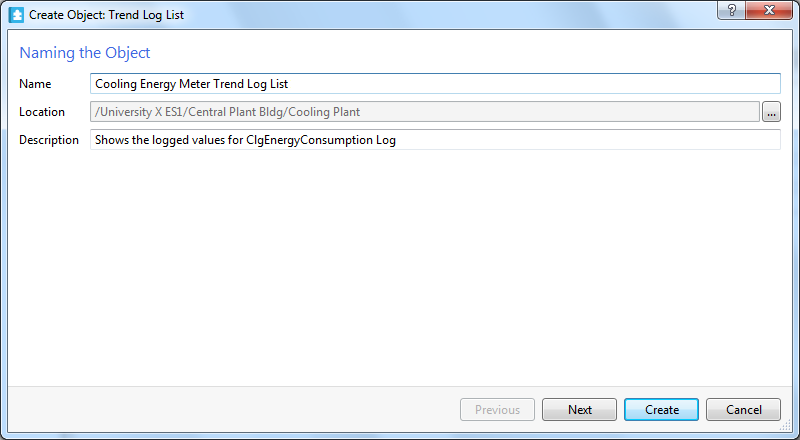
Click Next .
In the Display trend log box, confirm that the meter log is automatically entered.
action_zoom_plus_stroke 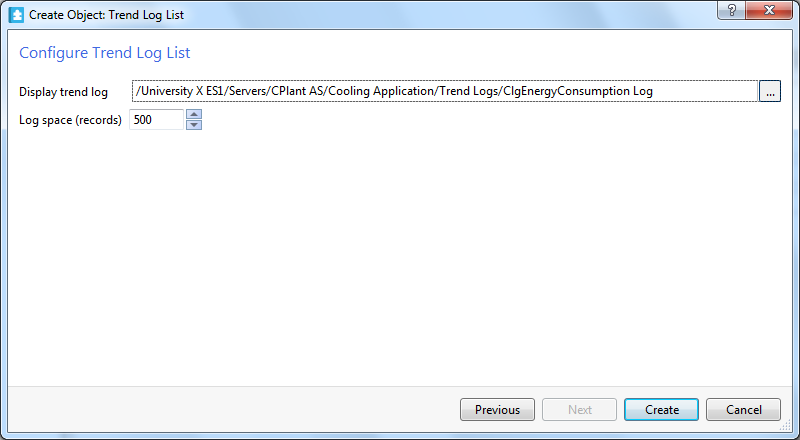
In the Log space (records) box, enter the maximum number of records to display in the trend log.
action_zoom_plus_stroke 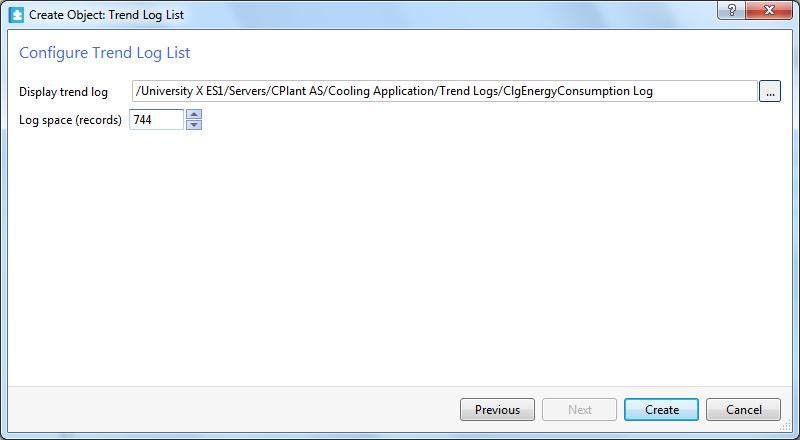
Click Create .
action_zoom_plus_stroke 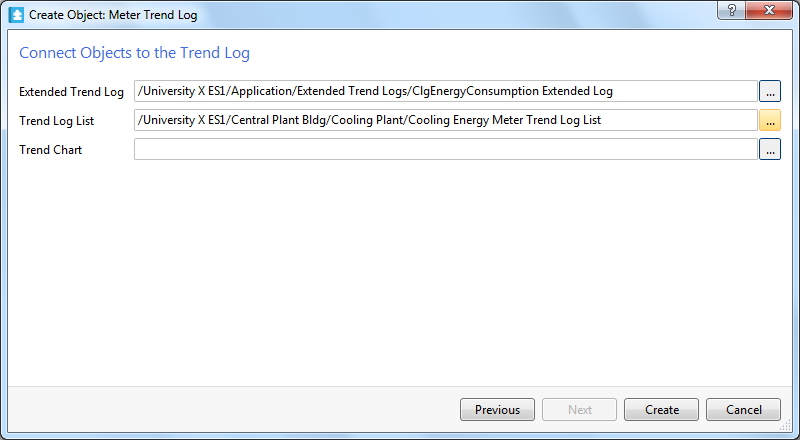
In the Trend Chart box, click the Browse button
to create a new trend chart and connect it to the existing trend log.action_zoom_plus_stroke 
Click Create .
action_zoom_plus_stroke 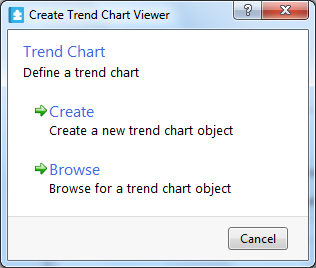
In the Name box, type a name for the trend chart.
action_zoom_plus_stroke 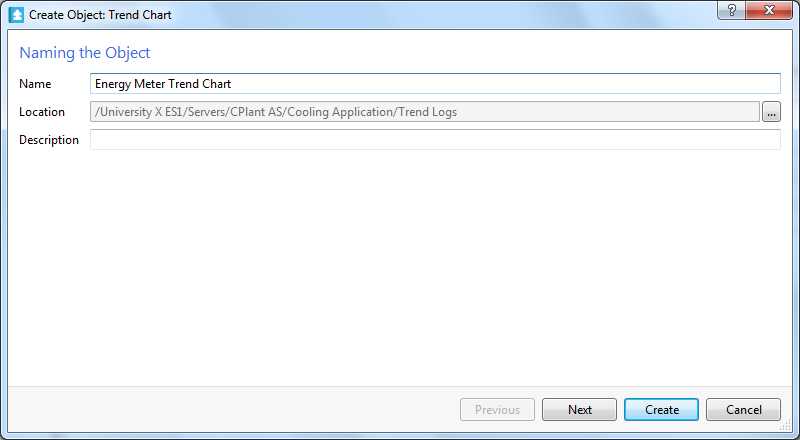
In the Location box, enter the path where to store the trend chart.
In the Description box, type a description for the trend chart.
action_zoom_plus_stroke 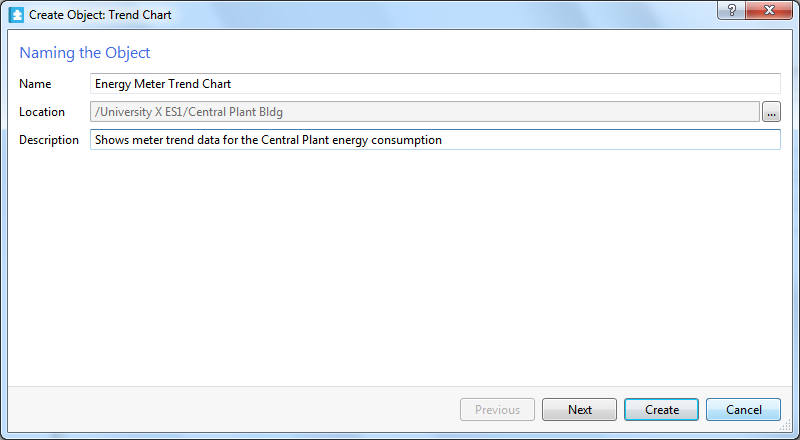
Click Next .
In the Time mode box, select the time mode for the trend chart:
Select Absolute (start and end time) and then enter a start time in the Start time box and an end time in the End time box to manually specify the x-axis start point and end point. Para obtener más información, consulte Trend Chart Axes .
Select Relative (to current time) and then type the time span in the Time span box to automatically adapt the x-axis of the chart to display the current time as the rightmost value. Para obtener más información, consulte Trend Chart Axes .
action_zoom_plus_stroke 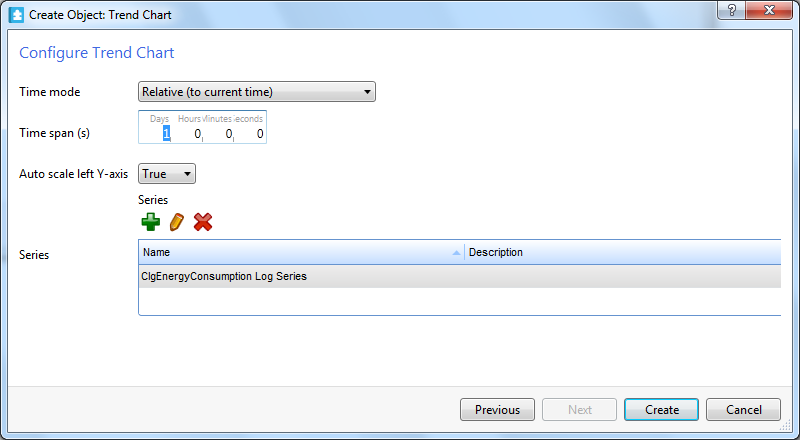
In the Auto scale left Y-axis box, select True to automatically adapt the y-axis scale to the trend log series.
action_zoom_plus_stroke 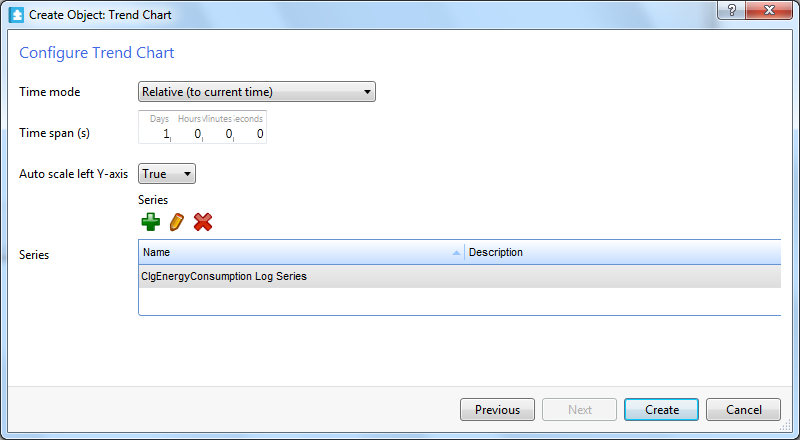
Under Series , click the Add button
to display additional trend data in the trend chart.action_zoom_plus_stroke 
In the object type list, select Trend Log Series or Real Time Trend Series .
action_zoom_plus_stroke 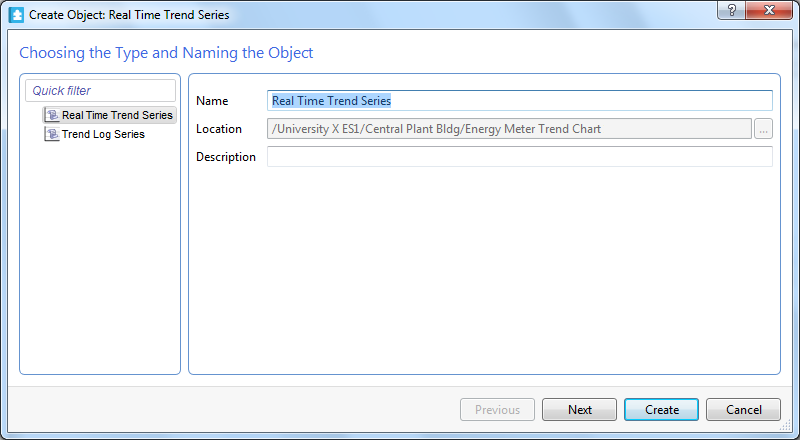
In the Name box, type a name for the series.
In the Description box, type a description for the series.
action_zoom_plus_stroke 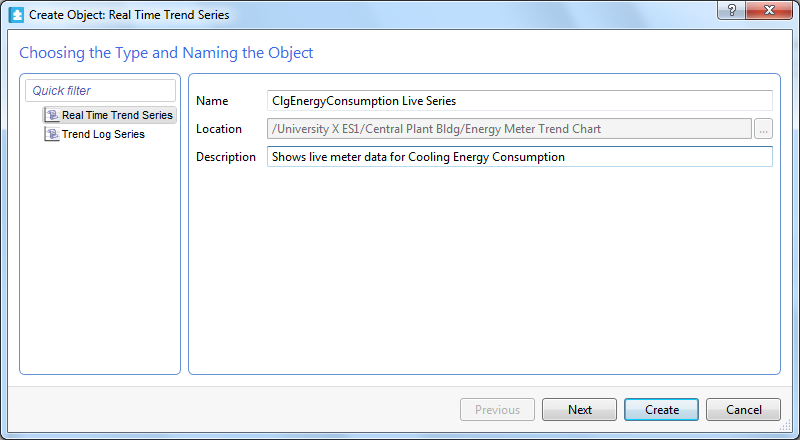
Click Next .
In the Display variable box, enter the variable you want to display in the trend chart.
action_zoom_plus_stroke 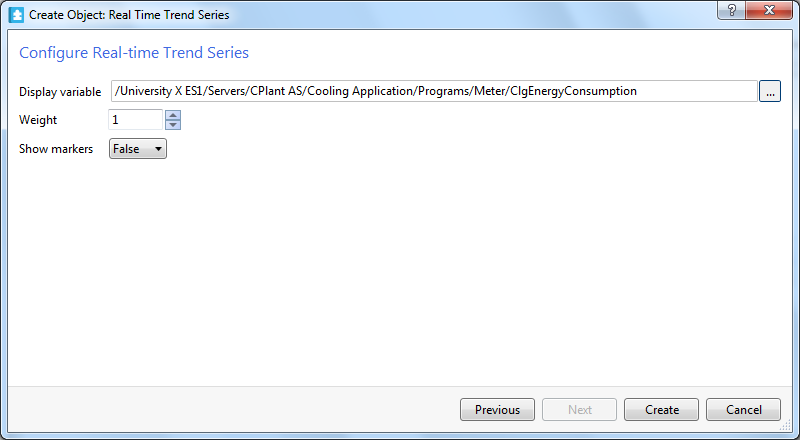
In the Weight box, enter the line weight of the series.
In the Show markers box, select True to display a marker for each recorded value.
action_zoom_plus_stroke 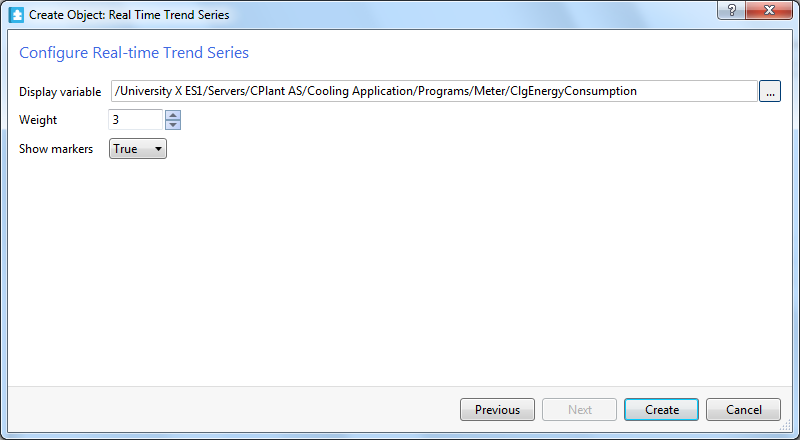
Click Create .
action_zoom_plus_stroke 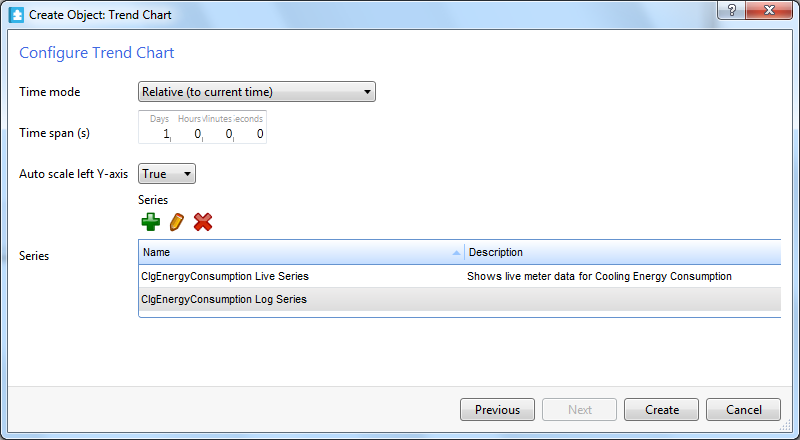
Click Create .
action_zoom_plus_stroke 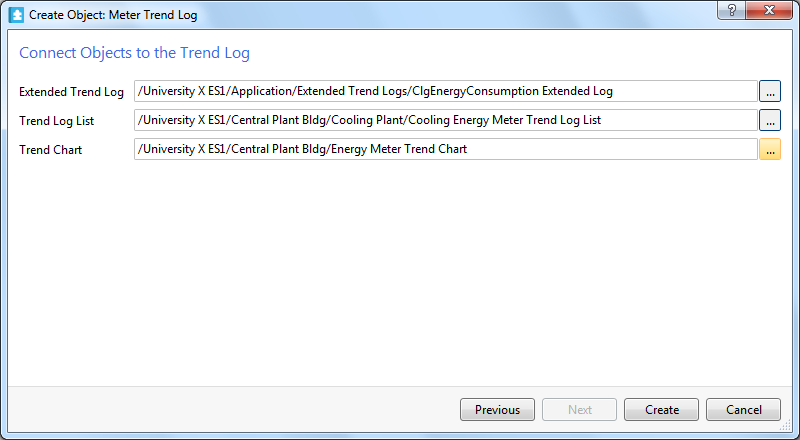
Click Create .
The meter trend log is now connected to an extended trend log, a trend log list, and a trend chart.
 Meter Trend Logs
 Managing Replacement of a Meter
 Trend Units
 Log Record Storage
 Create Object Wizard – Naming the Object Page
 Create Trend Log Wizard – Configure Meter Trend Log Page
 Extended Trend Logs
 Create Trend Log Wizard – Configure Extended Trend Log Page
 Trend Log Lists
 Create Trend Log Wizard – Configure Trend Log List Page
 Trend Charts
 Create Trend Log Wizard – Configure Trend Chart Page
 Trend Chart Axes
 Create Trend Log Wizard – Configure Trend Log Series Page
 Trend Log Wizard – Initial Meter Settings Page
