Log on to rate and give feedback
1
2
3
4
5
Log on to rate
0

How to
Products:
AS-B, Enterprise Central, Enterprise Server, AS-P, WorkStation, Virtual Project Servers
Functionalities:
Trends
Product version:
3.2, 3.3, 2022
10/15/2020
Creating a Real-Time Plot Trend Chart
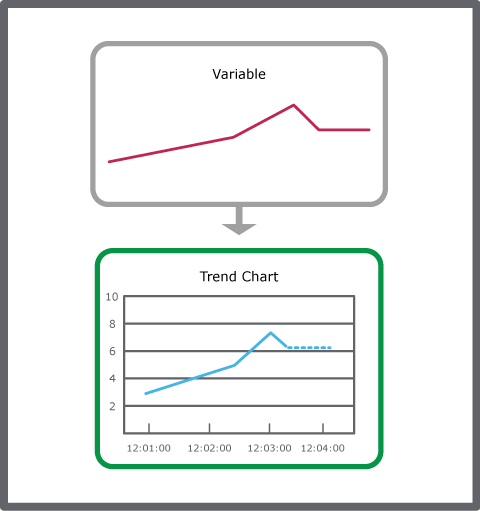
You create a real-time plot trend chart to display a variable in real time.
To create a real-time plot trend chart
In WorkStation, in the System Tree pane, select the variable you want to display in a real-time plot trend chart.
On the Actions menu, point to View and then click New Trend chart.
Click the Save button
.action_zoom_plus_stroke 
Browse to where you want to save the real-time plot trend chart.
Click Save .
By saving the real-time plot trend chart, a trend chart object is created in the System Tree pane.
 Real-Time Plotting
 Trend Chart View
 Saving the Trend Chart Settings
