Log on to rate and give feedback
1
2
3
4
5
Log on to rate
0

Modalità
Prodotti:
AS-B, Edge Server, Enterprise Central, Enterprise Server, AS-P, WorkStation, Project Configuration Tool
Funzionalità:
Tendenza
Versione del prodotto:
2023
21/05/2024
Creazione di un grafico del Trend per il tracciamento in tempo reale
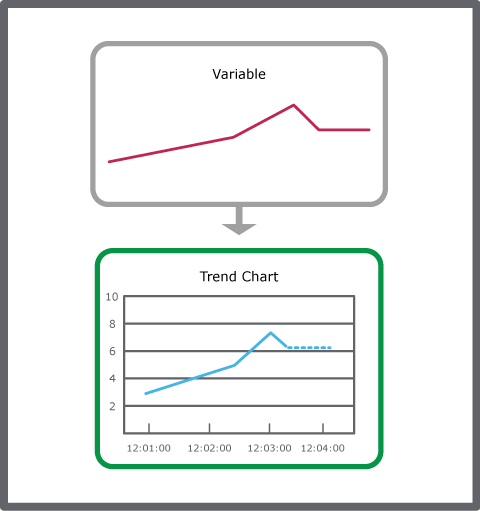
Puoi creare un grafico del Trend per il tracciamento in tempo reale per visualizzare una variabile in tempo reale.
Per creare un grafico del Trend per il tracciamento in tempo reale
In WorkStation, nella Struttura di sistema , seleziona la variabile che desideri visualizzare nel grafico del Trend per il tracciamento in tempo reale.
Nel menu Azioni , punta su Visualizza , quindi fai clic nel Nuovo grafico del Trend .
Fai clic il pulsante Salva
.action_zoom_plus_stroke 
Sfoglia l'ubicazione in cui desideri salvare il grafico del Trend per il tracciamento in tempo reale.
Fai clic su Salva .
Salvando il grafico del Trend per il tracciamento in tempo reale viene creato un oggetto grafico del Trend nel riquadro Struttura del sistema.
 Real-Time Plotting
 Visualizzazione di un grafico del Trend
 Salvataggio delle impostazioni di un grafico del Trend
