earth_america
user_standard Accedi
action_search_stroke
earth_america
Log on to rate and give feedback 1 2 3 4 5 Log on to rate
0
Modalità

Modalità


Prodotti: WebReports
Funzionalità: Report
Versione del prodotto: 2.0, 2.1, 3.0, 3.1, 3.2, 3.3
16/12/2021

Creating an Activities Per User Dashboard Report

You create an Activities Per User dashboard report when you want to enter and save filtering criteria, and then run the report in the future based on the same filtering criteria.

Mostra di più
action_close

Un report dashboard è un report in grado di elaborare i criteri di filtro fissi o predefiniti, al fine di generare l'output di un report.

Contrariamente ai report con prompt, i report dashboard elaborano l'output di un report basato su criteri di filtro predefiniti e generano l'output di report nel momento in cui selezioni il report. Non è necessario inserire i criteri di filtro o fare clic sul pulsante "Esegui" per generare il report.

Nell'albero dei report, i report dashboard sono identificati da un punto rosso accanto al nome del report. L'icona non appare accanto ai report dashboard nel riquadro Struttura del sistema, in WorkStation.

 
action_zoom_plus_stroke Report dashboard nella struttura dei report
Figura: Report dashboard nella struttura dei report

Criteri di filtro predefiniti

Puoi creare report dashboard sia in WorkStation che in un qualsiasi browser, usando l'opzione dashboard di WebReports. Seleziona questa opzione quando vuoi creare un report che usi gli stessi criteri di filtro ogni volta che esegui il report. Supponi, per esempio, di voler elaborare un report di allarme con un intervallo di date fisso (es. una settimana alla data). In fase di creazione del report, inserisci l'intervallo di date fisso e salva il report come report dashboard. La prossima volta che eseguirai il report, quest'ultimo considererà l'intervallo di date come criterio di filtro. Non è necessario inserire nuovamente l'intervallo di date per filtrare l'output del report.

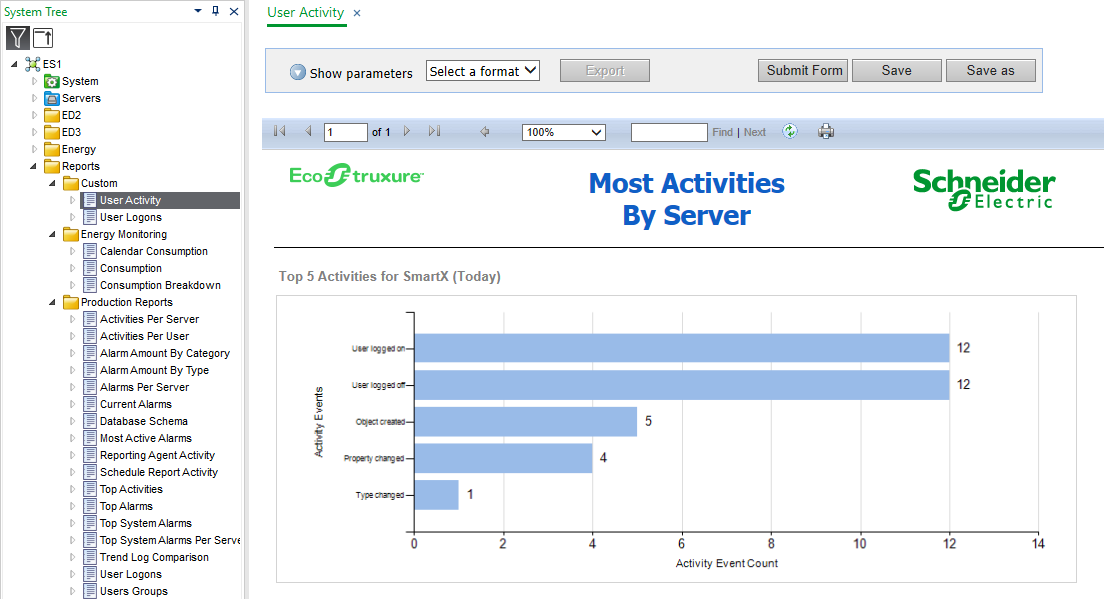
Per generare e visualizzare un report dashboard in WorkStation, seleziona il report nella cartella Report, riquadro Struttura di sistema.

 
action_zoom_plus_stroke Report dashboard in WorkStation
Figura: Report dashboard in WorkStation

Dopo aver selezionato il report, l'output del report appare nell'area di lavoro. Non è necessario inserire i criteri di filtro o fare clic sul pulsante "Esegui" per generare l'output del report.

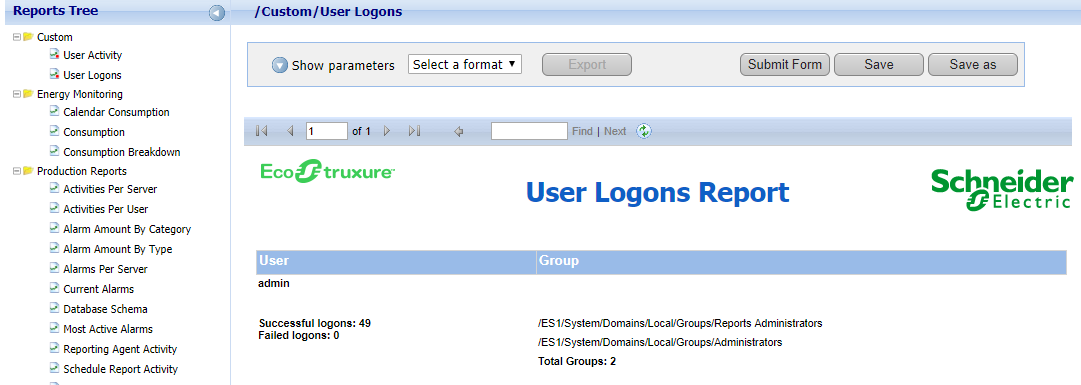
Per generare e visualizzare un report dashboard nel tuo browser, effettua il login al sito web di WebReports e seleziona il report nella struttura di sistema.

 
action_zoom_plus_stroke Report dashboard in un browser
Figura: Report dashboard in un browser

Dopo aver selezionato il report, l'output del report appare nel browser. Non è necessario inserire i criteri di filtro o fare clic sul pulsante "Esegui" per generare l'output del report.

Programma Orario per report dashboard

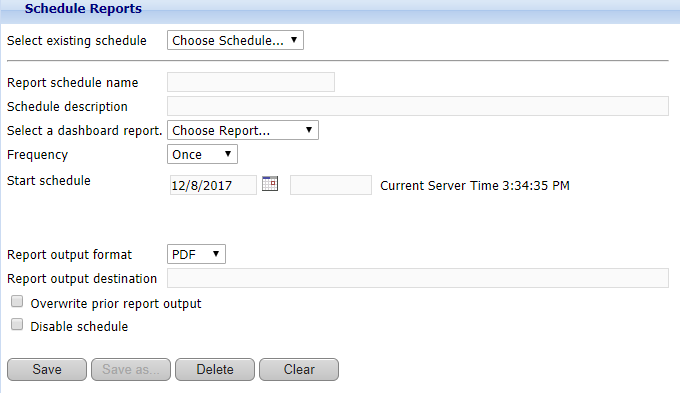
Puoi creare report dashboard anche quando intendi usare la programmazione oraria di WebReports ed eseguire report in giorni prestabiliti. .

 
action_zoom_plus_stroke Programma Orario WebReport
Figura: Programma Orario WebReport

To create an Activities Per User dashboard report
  1. In WebReports, on the menu bar, click View .

  2. In the Reports Tree , expand Production Reports and then select Activities Per User .

  3. In the Date Range Filter box, select one of the following filter options to define the start time and end time for the report:

    • Select one of the predefined date range filters.

    • Select Fixed Date , and in the Start Report Date/Time boxes, enter a start date and type a start time. In the End Report Date/Time boxes, enter an end date and type an end time.

  4. In the User box, select the user you want to view activities for.

    Avviso
    • You can only create reports for users that have performed some actions, for example, logged on to the system or created an object.

  5. In the Report View box, select how you want the information to be displayed.

  6. In the Show Top box, select the number of user activities you want in the report.

  7. Click Submit Form .

  8. Click Save as .

  9. In the Report name box, type a folder name and report name for the dashboard report.

  10. Select Dashboard report .

  11. Click Save as .

  12. Click OK .

  • Report dashboard
  • Visualizzazione di un Report Dashboard in WorkStation
  • Creating a Trend Log Comparison Dashboard Report
  • Creating a Dashboard Report in WorkStation
  • Creating a Dashboard Report in WebReports
  • Creating a Consumption Dashboard Report
  • Visualizzazione di Report Dashboard in WebReports