Log on to rate and give feedback
1
2
3
4
5
Log on to rate
0

Hur göra
Produkter:
AS-B, Enterprise Central, Enterprise Server, AS-P, WorkStation, Project Configuration Tool
Funktionaliteter:
Trender
Produktversion:
3.2, 3.3, 2022
2021-07-22
Editing the Trend Chart Settings
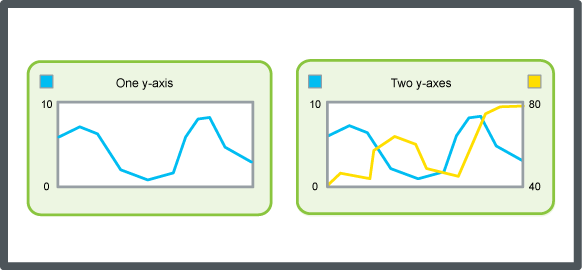
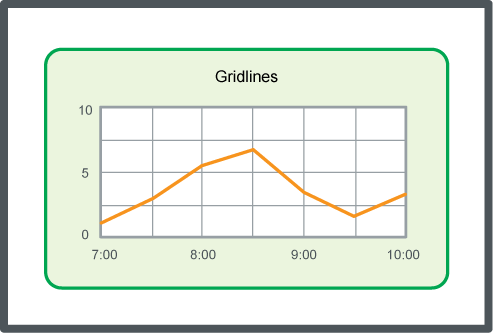
You configure the scale of the trend chart axes, the presentation of series, and the calculation method to make it easier to interpret the series, representing the trend log records, in the trend chart.
To edit the trend chart settings
In WorkStation, in the System Tree pane, select the trend chart.
On the Trend Chart toolbar, click Open trend chart settings button
.action_zoom_plus_stroke 
In the Trend Chart Settings dialog box, edit the trend chart settings.
Click OK .
 Trend Chart Axes
 Trend Chart Settings Dialog Box – Axes Tab
 Trend Chart Event Icons
 Trend Chart View


