
Modalità
Visualizzazione delle linee della griglia di un grafico del Trend
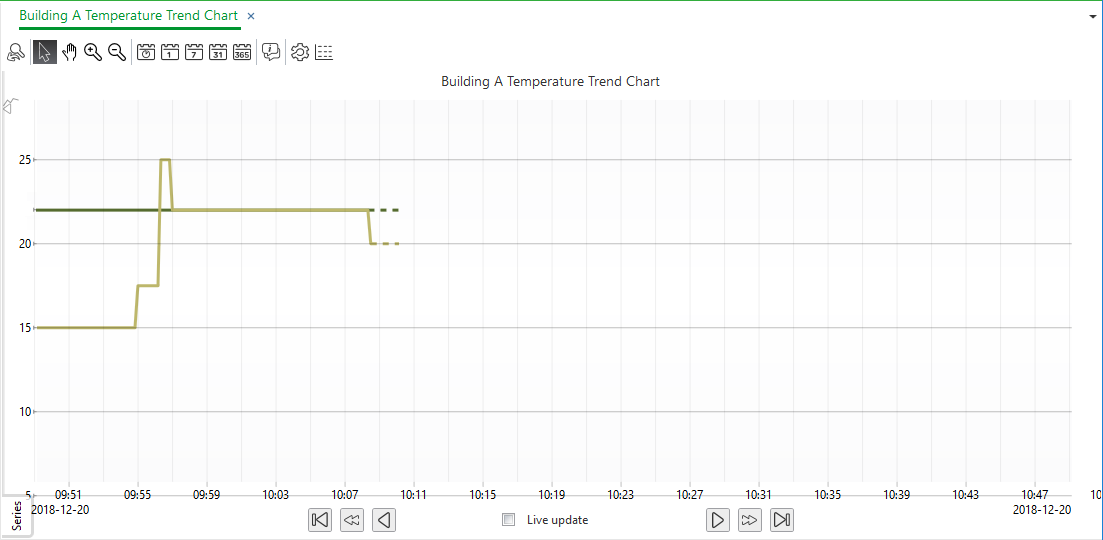
Per facilitare la lettura del grafico, puoi visualizzare le linee della griglia sull'asse x e sull'asse y.
Use the Axes tab to configure the properties of the chart axes.

|
Component |
Description |
|
Time mode |
Select the time mode of the x-axis.
|
|
Start time |
Enter the absolute start time when Time mode is set to Absolute. This time is the leftmost point of the x-axis.
|
|
End time |
Enter the absolute end time when Time mode is set to Absolute (start time and end time) . This time is the rightmost point of the x-axis. |
|
Time span |
Type the relative time span of the x-axis when Time mode is set to Relative (to current time) . The rightmost point of the x-axis is the current time. |
|
Time zone |
Select time zone for the trend chart. The time zone is the displayed time perspective of the trend log. |
|
Show grid lines |
Select to show horizontal grid lines. |
|
Auto scale left y-axis |
Select to activate auto scale. The scale of the left Y-axis adapts itself to the displayed series.
|
|
Left y-axis minimum |
Type the minimum value of the left y-axis. |
|
Left y-axis maximum |
Type the maximum value of the left y-axis. |
|
Show left grid lines |
Select to show grid lines on the left y-axis. |
|
Auto scale right y-axis |
Select to activate auto scale. The scale of the right y-axis adapts itself to the displayed series. |
|
Right y-axis minimum |
Type the minimum value of the right y-axis. |
|
Right y-axis maximum |
Type the maximum value of the right y-axis. |
|
Show right grid lines |
Select to show grid lines on the right y-axis. |
In WorkStation, nel riquadro Struttura di sistema , seleziona il grafico di trend da configurare.
Nella barra degli strumenti Grafico Trend , fai clic sul pulsante Apri impostazioni grafico Trend
.action_zoom_plus_stroke 
Sotto la casella Fuso orario , Seleziona Mostra linee griglia per mostrare le linee della griglia derivanti dalla scala dell'asse x.
Seleziona Mostra linee griglia sinistra o Mostra linee griglia destra per mostrare le linee guida originarie dalla scala dell'asse y.
Fai clic su OK .
Le linee della griglia appaiono nel grafico del Trend. Ripeti la procedura per nascondere le linee della griglia.
 Assi del grafico del Trend
Grafici del Trend
Assi del grafico del Trend
Grafici del Trend
 Trend Chart Settings Dialog Box – Axes Tab
Icone eventi di un grafico del Trend
Trend Chart Settings Dialog Box – Axes Tab
Icone eventi di un grafico del Trend