Log on to rate and give feedback
1
2
3
4
5
Log on to rate
0

Hur göra
Produkter:
AS-B, Enterprise Central, Enterprise Server, AS-P, WorkStation, Project Configuration Tool
Funktionaliteter:
Trender
Produktversion:
3.2, 3.3, 2022
2020-10-15
Showing Trend Chart Grid Lines
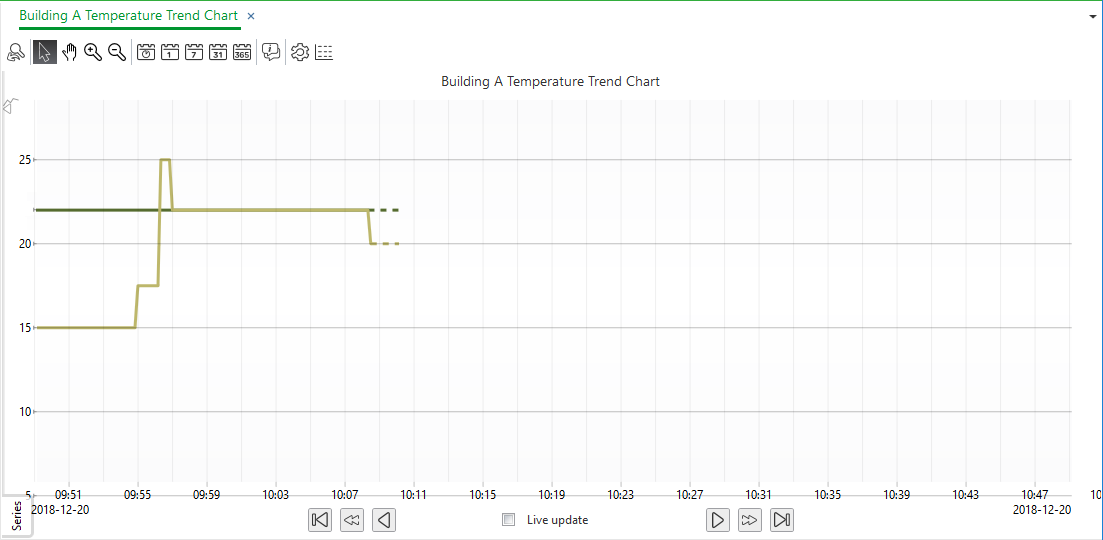
You show the trend chart grid lines on the x-axis and the y-axis to make the chart easier to read.
To show trend chart grid lines
In WorkStation, in the System Tree pane, select the trend chart you want to configure.
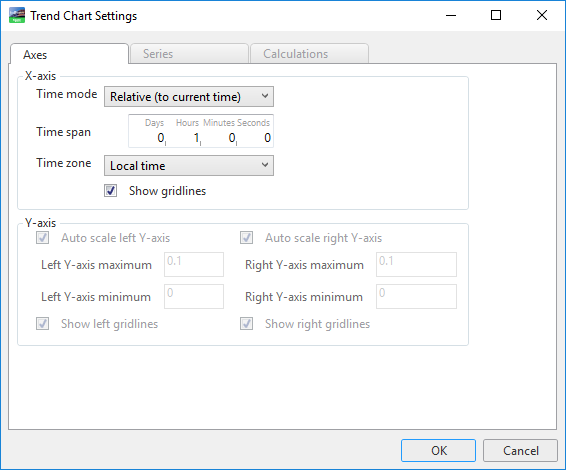
On the Trend Chart toolbar, click the Open trend chart settings button
.action_zoom_plus_stroke 
Below the Time zone box, select Show grid lines to show grid lines originating from the x-axis scale.
Select Show left grid lines or Show right grid lines to show grid lines originating from the y-axis scale.
Click OK .
Grid lines are now shown in the trend chart. Repeat the procedure to hide the grid lines.

 Trend Chart Axes
 Trend Charts
 Trend Chart Settings Dialog Box – Axes Tab
 Trend Chart Event Icons
