earth_america
user_standard 登录
action_search_stroke
earth_america
登录以评价并提供反馈 1 2 3 4 5 登录以评价
0
如何

如何


产品: AS-B, Edge Server, Enterprise Central, Enterprise Server, AS-P, WorkStation, Project Configuration Tool
功能: 趋势
产品版本: 2023
2024/5/21

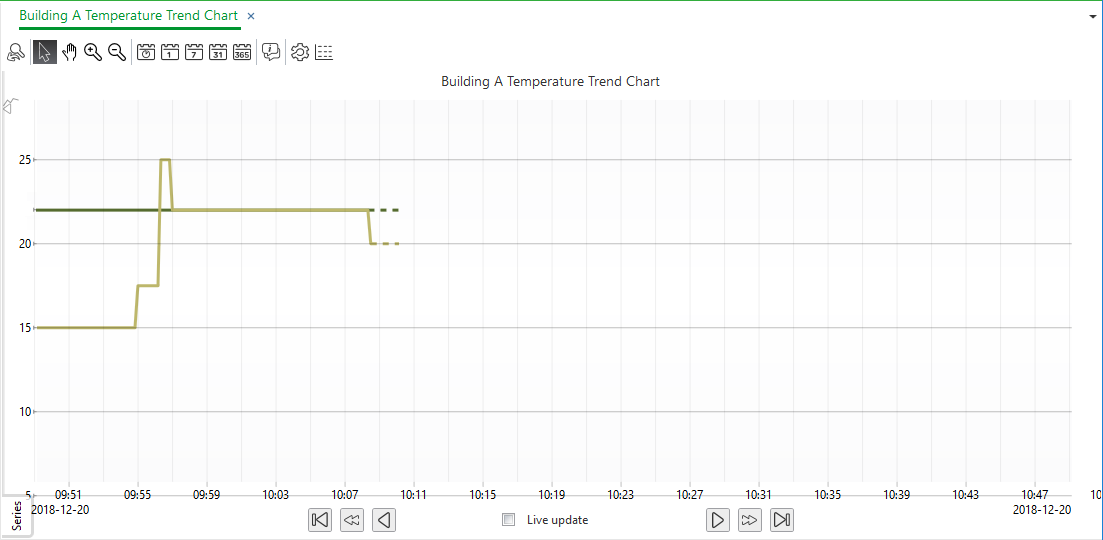
显示趋势图网格线

您可以在 X 轴和 Y 轴上显示趋势图网格线,以轻松查看图。

显示更多
action_close

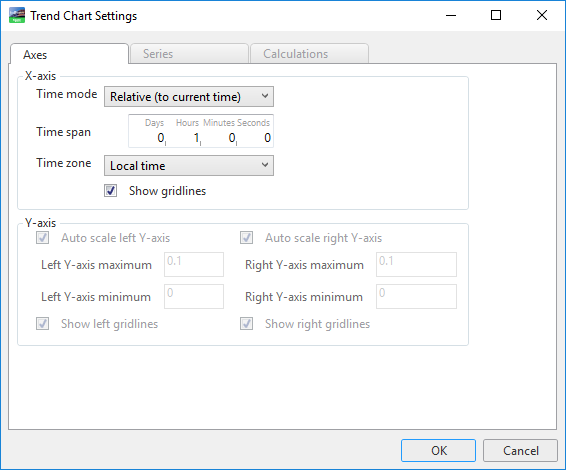
Use the Axes tab to configure the properties of the chart axes.

 
action_zoom_plus_stroke Axes tab
图: Axes tab

表格: Axes Tab

Component

Description

Time mode

​Select the time mode of the x-axis.

Start time

Enter the absolute start time when Time mode is set to Absolute. This time is the leftmost point of the x-axis.

End time

Enter the absolute end time when Time mode is set to Absolute (start time and end time) . This time is the rightmost point of the x-axis.

Time span

Type the relative time span of the x-axis when Time mode is set to Relative (to current time) . The rightmost point of the x-axis is the current time.

Time zone

Select time zone for the trend chart. The time zone is the displayed time perspective of the trend log.

Show grid lines

Select to show horizontal grid lines.

Auto scale left y-axis

Select to activate auto scale. The scale of the left Y-axis adapts itself to the displayed series.

Left y-axis minimum

Type the minimum value of the left y-axis.

Left y-axis maximum

Type the maximum value of the left y-axis.

Show left grid lines

Select to show grid lines on the left y-axis.

Auto scale right y-axis

Select to activate auto scale. The scale of the right y-axis adapts itself to the displayed series.

Right y-axis minimum

Type the minimum value of the right y-axis.

Right y-axis maximum

Type the maximum value of the right y-axis.

Show right grid lines

Select to show grid lines on the right y-axis.

显示趋势图网格线
  1. 在 WorkStation 的 系统树 窗格,选择想要配置的趋势图。

  2. 趋势图 工具栏,点击 打开趋势图设置 按钮

     
    action_zoom_plus_stroke

  3. 时区 框中,选择 显示网格线 可显示源自 X 轴标度的网格线。

  4. 选择 显示左边网格线 显示右边网格线 可显示源自 Y 轴标度的网格线。

  5. 点击 确定

趋势图中现在会显示网格线。重复此步骤以隐藏网格线。

 
action_zoom_plus_stroke

  • 趋势图轴
  • 趋势图
  • Trend Chart Settings Dialog Box – Axes Tab
  • 趋势图事件图标