
Ratgeber
Eine Trendlog-Serie einem Trenddiagramm hinzufügen
Sie können einem Trenddiagramm eine Trendlog-Serie hinzufügen, um Trenddaten verschiedener Logs oder Variablen zu vergleichen.
Trend charts are a way to graphically present trend logs. A trend chart can contain one or more trend logs that are represented in the trend chart by lines or bars.
You can also add and remove trend logs from a trend chart. This makes it easy to compare different trend logs, for example the energy consumption compared to the average temperature.

Trend Chart Navigation in WorkStation
The trend chart contains a lot of tools for easy navigation in the chart. You can scroll or use the predefined settings to focus on the time span you want to see.
Für weitere Informationen siehe Trend Chart Navigation in WorkStation .
Trend Chart Navigation in WebStation
The trend chart contains a lot of tools for easy navigation in the chart. You can scroll or use the predefined settings to focus on the time span you want to see.
Für weitere Informationen siehe Trend Chart Navigation in WebStation .
Trend Chart Series in WorkStation
You can display the trend logs as trend log series in a trend chart in a number of ways. For example, you can change the color and weight of the trend log line, or display markers at the time where the trend log value was sampled.
Für weitere Informationen siehe Trend Chart Series in WorkStation .
Trend Chart Series in WebStation
You can display the trend logs as trend log series in a trend chart in a number of ways. For example, you can change the color and weight of the trend log line, or display markers at the time where the trend log value was sampled.
Für weitere Informationen siehe Trend Chart Series in WebStation .
Trend Chart Axes in WebStation
A trend chart displays the records of a trend log or an extended trend log as a series.
Für weitere Informationen siehe Trend Charts .
Wählen Sie in WebStation im Systembaum -Fenster das Trenddiagramm, dem Sie die Trendlog-Serie hinzufügen möchten.
action_zoom_plus_stroke 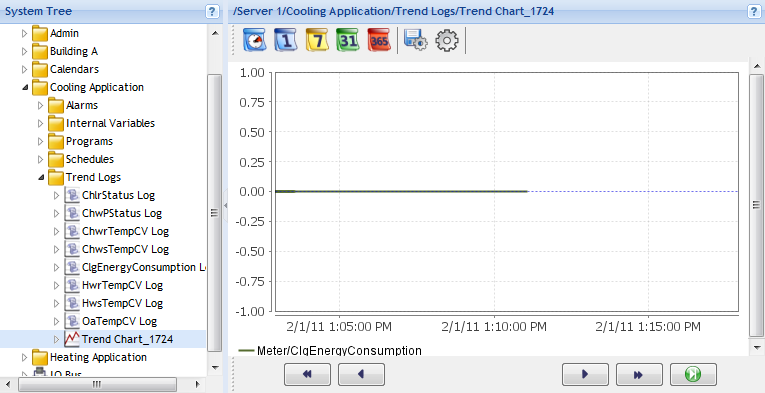
Klicken Sie im Systembaum -Fenster mit der rechten Maustaste auf den Trendlog, zeigen Sie auf Diagramm öffnen und wählen Sie dann Zu bereits geöffneten Trenddiagrammen hinzufügen .
action_zoom_plus_stroke 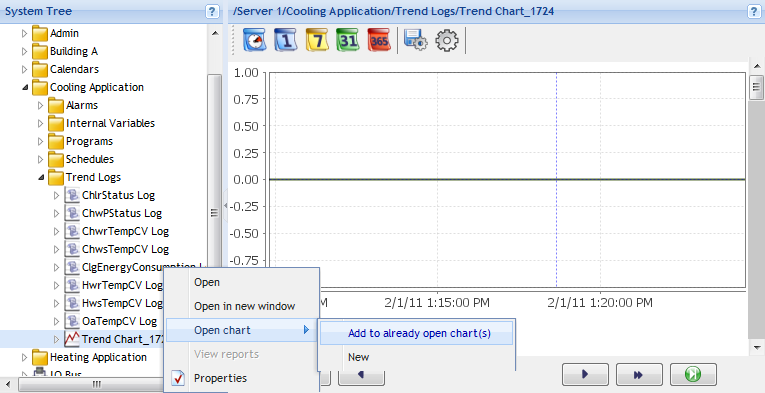
Um die Änderungen des Trenddiagramms zu speichern, klicken Sie das Feld Aktuelle Einstellungen speichern
.action_zoom_plus_stroke 
Die Trendlog-Serie wurde dem Trenddiagramm hinzugefügt.

 Trend Chart Series in WebStation
How Trend Charts Work
Displaying Specific Time Spans of a Trend Chart
Changing the Line Weight of a Trend Chart Series
Changing the Color of a Trend Chart Series
Changing the Presentation Type of a Trend Chart Series
Showing Markers in a Trend Log Series
Show Tooltips for All Series in a Trend Chart
Eine Serie in einem Trenddiagramm ausblenden
Removing a Trend Chart Series
Saving Current Trend Chart Settings
Trend Chart View
Trend Chart Series in WebStation
How Trend Charts Work
Displaying Specific Time Spans of a Trend Chart
Changing the Line Weight of a Trend Chart Series
Changing the Color of a Trend Chart Series
Changing the Presentation Type of a Trend Chart Series
Showing Markers in a Trend Log Series
Show Tooltips for All Series in a Trend Chart
Eine Serie in einem Trenddiagramm ausblenden
Removing a Trend Chart Series
Saving Current Trend Chart Settings
Trend Chart View
 Context Menu
 – Trend Charts Submenu
Trend Chart Toolbar
Context Menu
Context Menu – Trend Charts Submenu
Trend Chart Toolbar