How to
Creating a Consumption Dashboard Report
You create a Consumption dashboard report when you want to define fixed filtering criteria, and then run the report in the future with the same filtering criteria applied.
In WebReports, on the menu bar, click View .
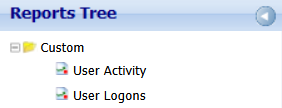
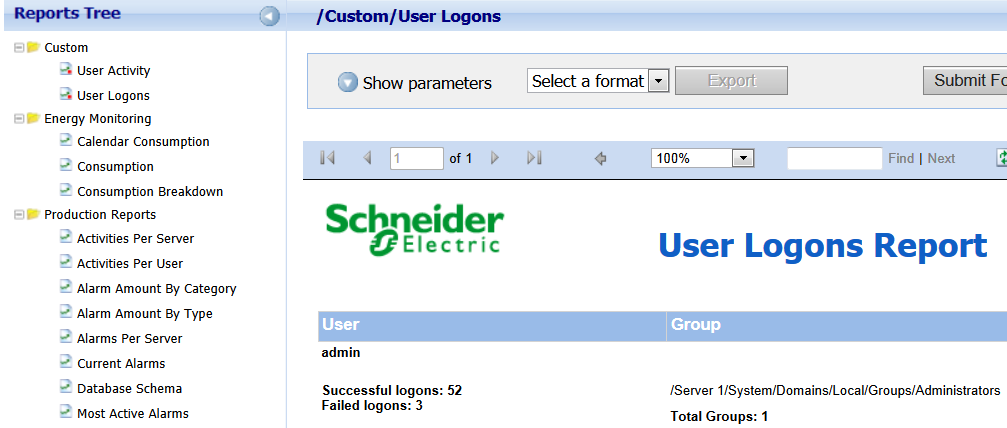
In the Reports Tree , expand Energy Monitoring and then select Consumption .
In the Utility Type box, select the utility type.
action_zoom_plus_stroke 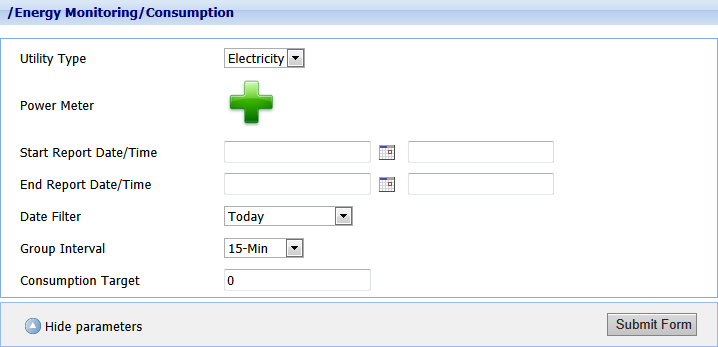
At the Power Meter box, point to the green plus sign and then select the site or meter for which you want to see consumption.
In the Date Filter box, select one of the following filter options to define the start time and end time for the report:
Select one of the predefined date range filters.
Select Fixed Date , and in the Start Report Date/Time boxes, enter a start date and type a start time. In the End Report Date/Time boxes, enter an end date and type an end time.
In the Group Interval box, select the time interval for grouping the report data.
In the Consumption Target box, type the consumption goal for the selected time range.
action_zoom_plus_stroke 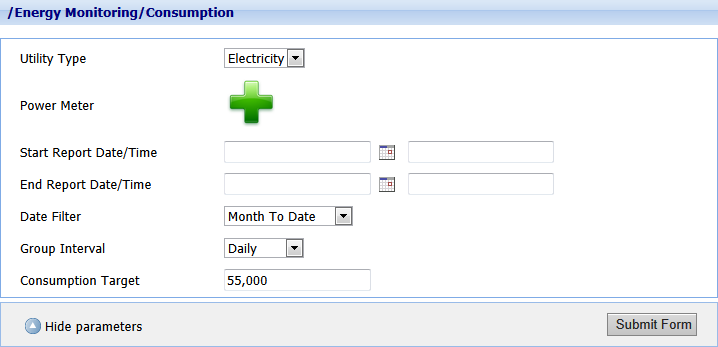
Click Submit Form .
Click Save as .
In the Report name box, type a folder name and report name for the dashboard report.
action_zoom_plus_stroke 
Select Dashboard report .
Click Save as .
Click OK .
 Dashboard Reports
 Viewing a Dashboard Report in WorkStation
 Viewing a Dashboard Report in WebReports
 Creating an Activities Per User Dashboard Report
 Creating a Trend Log Comparison Dashboard Report
 Creating a Dashboard Report in WorkStation
 Creating a Dashboard Report in WebReports
