Interfaccia dell'utente
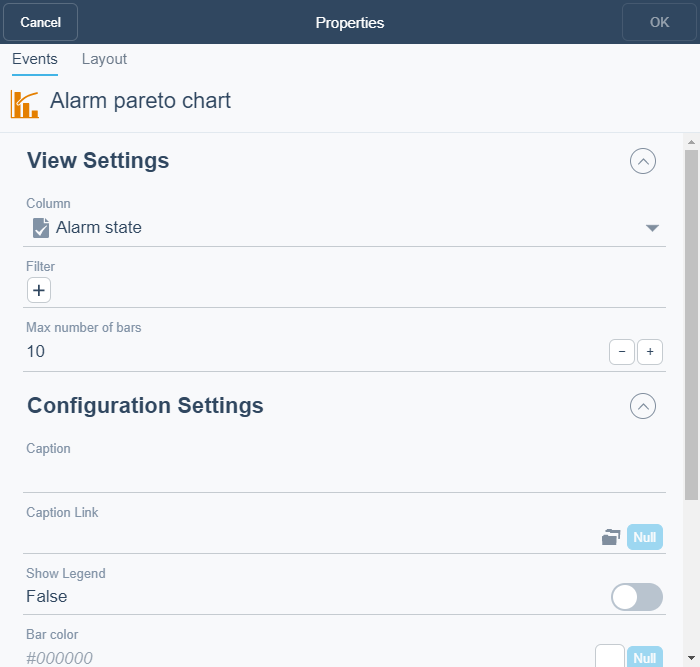
Finestra di dialogo Grafico di Pareto degli allarmi
Usare la finestra di dialogo Grafico di Pareto degli allarmi per configurare e modificare un diagramma di Pareto degli allarmi.

|
Componente |
Descrizione |
|
Colonna |
Select the column(s) you want to display in the widget. |
|
Filtro |
Select the filter you want to apply. |
|
Numero max. di barre |
Enter the number of bars you want to display in the chart. |
|
Didascalia |
Type a caption for the widget. |
|
Link didascalia |
Select to make a link to an object that is relevant to the values that are displayed in the widget. |
|
Mostra legenda |
Click True to display the name and color of the trend log in the widget. |
|
Mostra periodo |
Select to display the period as a legend. |
|
Colore barra |
Select the color you want to use on the bars. |
|
Minimo asse Y |
Enter the Y-axis minimum. |
|
Massimo asse Y |
Enter the Y-axis maximum. |
|
Asse Y |
Select the position of the y-axis. |
|
Decimali |
Select the number of decimals you want to display. |
 Come funzionano i dashboard
 Dashboard Widgets
 Finestra di dialogo Widget – Scheda Layout