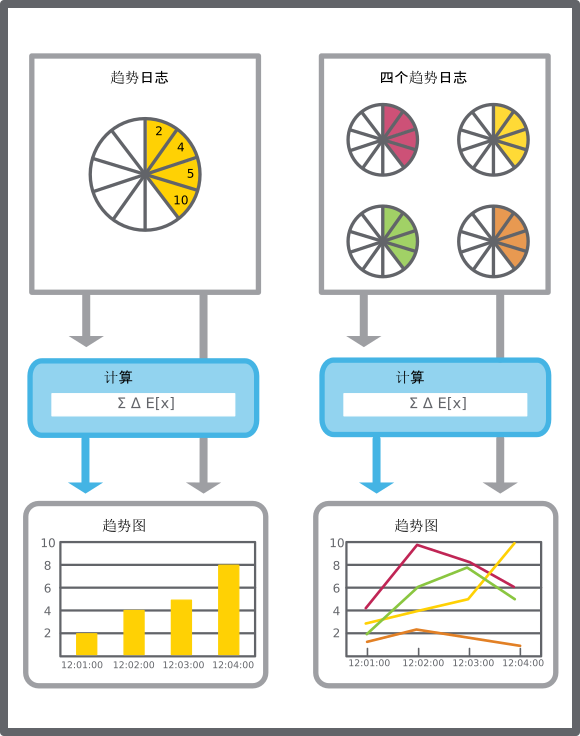
A trend chart displays the records of a trend log or an extended trend log as a series.
如果激活了 WorkStation 中的
实时更新
或 WebStation 中的
自动滚动
,展示趋势日志的趋势图系列会自动通过最新记录进行更新。展示现场控制器趋势日志的记录的趋势图系列需要手动刷新。
趋势图能展示的趋势日志数没有上限。但是,显示的趋势日志数越多,性能就越低。趋势日志记录在趋势图中展示之前可以先通过计算方法进行处理。计算功能支持负消耗值,它可用于处理您需要减去消耗量的情况,例如现场产生能量引起的消耗。
action_zoom_plus_stroke

图:
趋势图示意图
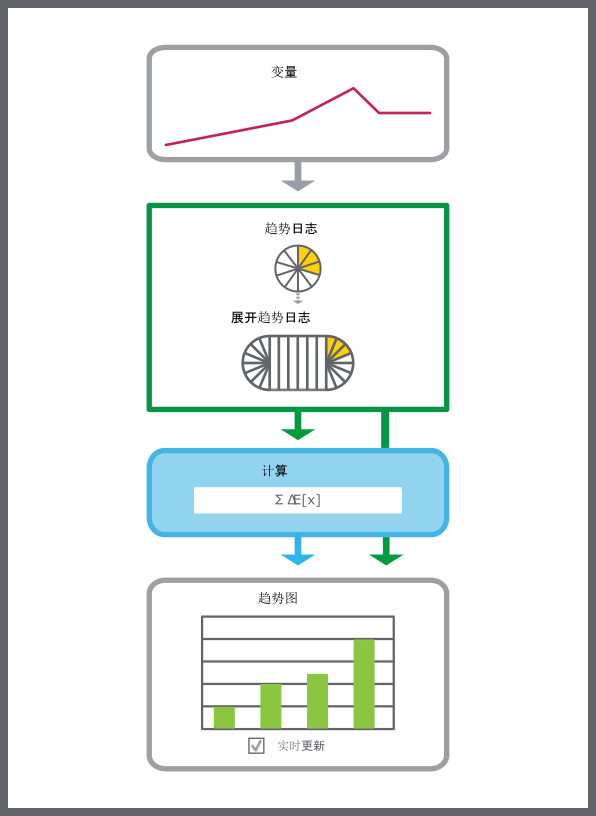
当趋势图实时显示展开趋势日志的记录时,已连接的趋势日志的最新记录会频繁传输到展开趋势日志。这可以减少在趋势日志传输新记录之前展开趋势日志要等待达到传输阈值时出现的延迟。通过此方法,趋势图可显示最新记录。
action_zoom_plus_stroke

图:
在打开的实时趋势图中显示的展开趋势日志,会频繁将趋势日志的最新记录传输到展开趋势日志。
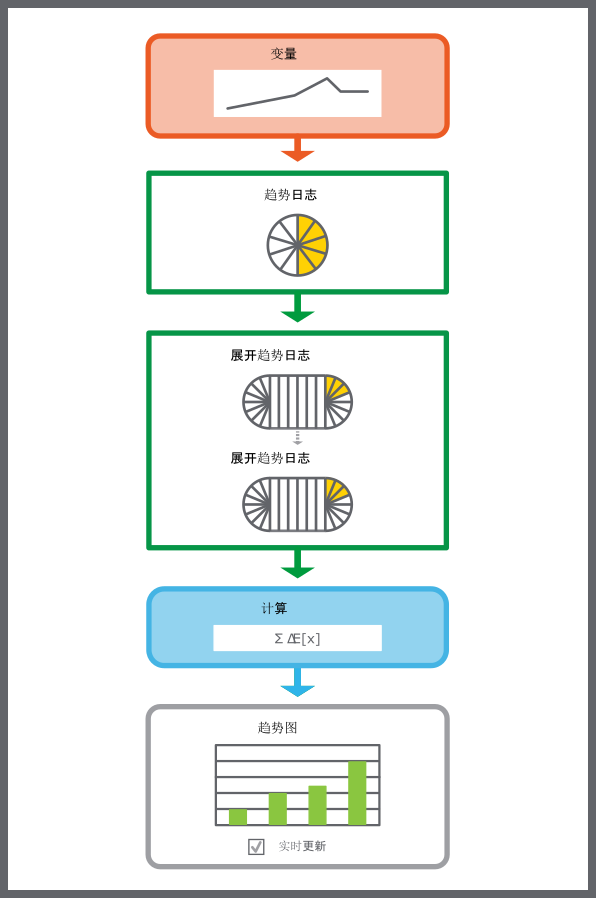
如果在趋势日志和趋势图之间连接了两个展开趋势日志,则趋势图实时展示记录时所发生的传输仅会传输最近的展开趋势日志的记录。趋势日志和先连接的趋势日志之间的传输阈值速率不受影响。
action_zoom_plus_stroke

图:
当两个展开趋势日志以系列方式连接趋势日志和趋势图时,最新的趋势日志记录不会在实时趋势图中显示相同的短时延迟。
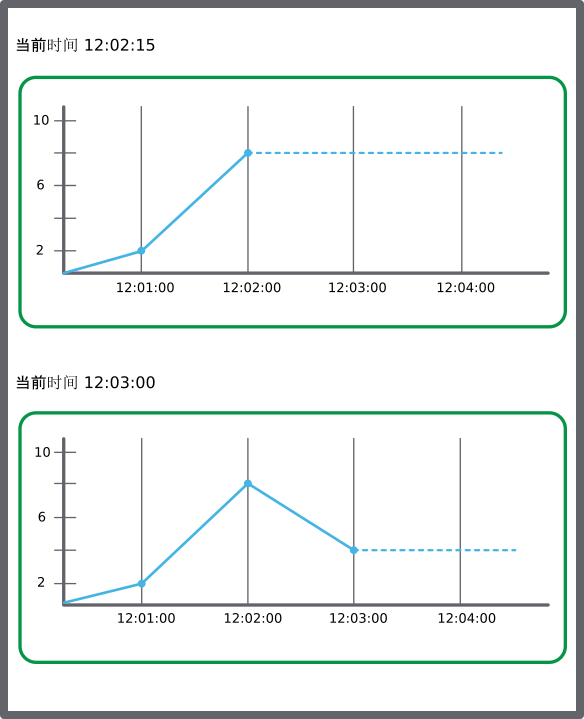
等待新记录时,趋势图会从最后一个记录的值开始往后绘制虚线。记录新值时,最后一个记录和新记录之间的虚线会替换为一系列实线。
action_zoom_plus_stroke

图:
如果未记录值,则趋势图会绘制虚线。
动态趋势图标题
趋势图支持趋势图标题的相关属性参考。您可以重复使用趋势图并使趋势图标题随着粘贴、复制、导入或移动趋势图动态地变化。趋势图的图表标题属性是趋势图标题的第一部分,趋势图的描述属性是趋势图标题的最后部分。比如,在相对属性参考中,'../../NAME' where '../' 代表文件夹或容器对象。
如果图表标题属性为空或包含一个未解决的参考,趋势图对象名称是趋势图标题的第一部分。
趋势图标题在趋势图打印输出中可见。
趋势图系列
In a trend chart, a series can be presented as a line, discrete line, digital, or bars. In a trend chart, series can be presented in different colors and with different line weights.
In WorkStation, in a multi trend log list, series are presented as text and can be exported to .XML or .CSV.
有关更多信息,请参阅 Trend Series
.
WorkStation 中的趋势图轴
The x-axis of the trend chart represents time. The time span of the axis can be set with a fixed start and end time or with an end time relative to the present time. The axis can be quick-scaled to show the last hour, last day, last month, or last year.
有关更多信息,请参阅 趋势图轴
.
WebStation 中的趋势图轴
The x-axis of the trend chart represents time. The time span of the axis can be set with a fixed start and end time or with an end time relative to the present time. The axis can be quick-scaled to show the last hour, last day, last month, or last year.
有关更多信息,请参阅 WebStation 中的趋势图轴
.
实时绘图
The real-time plot is a variable displayed directly in the trend chart. The real-time plot is an instant reflection of the variable, so the history of the real-time plot is lost when the trend chart is closed. However, the history is not lost for I/O points that have implicit logs where approximately 500 records of history are displayed.
有关更多信息,请参阅 Real-Time Plotting
.
趋势图中的时区模式
In a trend chart, you can present the records of a trend log in different time zones: local time or a predefined time zone.
有关更多信息,请参阅 Time Zone Modes in a Trend Chart
.
计算方法
Use a calculation method to process the records of the trend log before presenting them in a trend log list or a trend chart. The original records in the trend log are not affected by the calculation method. The calculation method is applied to the trend log records grouped by a specific time interval.
有关更多信息,请参阅 计算方法
.
趋势图和趋势日志列表中的周期时间戳
When a calculated value for a period is presented, the middle of the period is used as the timestamp.
Example:
The calculated value for the period 8:00-9:00 is stamped 8:30. If there is a value at 9:01, the next period is 9:00-10:00, which is stamped as 9:30. The full period may not have passed yet, but the value can be presented even if parts of the period are in the future.
临时趋势图
To display a trend log without creating a new trend log list or trend chart, the trend log can be displayed in a temporary list or chart.
有关更多信息,请参阅 Temporary Trend Charts
.
浮点值 NaN、INF 和 –INF
In the EcoStruxure Building Operation software, the floating point values “Not a Number”, positive infinity, or negative infinity may be displayed in the
Basic
property tab, in a trend log list, or a trend chart.
有关更多信息,请参阅 Floating Point Values NaN, INF, and –INF
.

 趋势图
趋势图
 Create Object Dialog – Naming the Object Page
 Create Trend Chart Wizard – Configure Trend Chart Page
 Create Object Dialog – Naming the Object Page
 Create Trend Chart Wizard – Configure Trend Log Series Page
 打开趋势图
打开趋势图


