User Interface
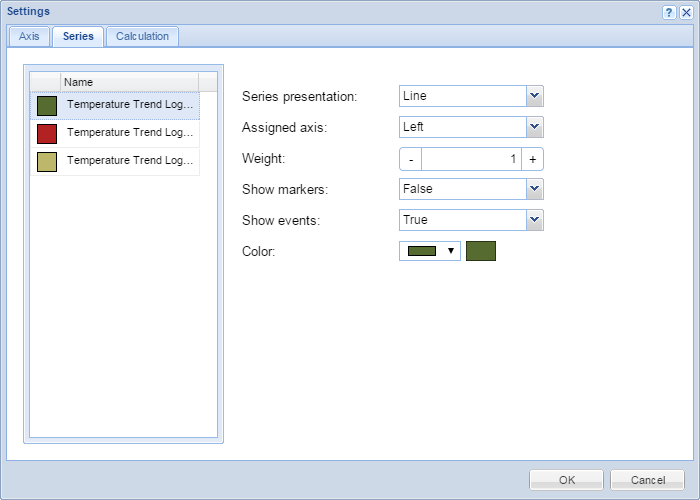
Trend Chart Settings Dialog Box – Series Tab
Use the Series tab in WebStation to change the presentation of a series in a trend chart.

|
Component |
Description |
|
Trend chart list |
Displays the path to the trend chart series. |
|
Series presentation |
Select a presentation type for the series. The series can be presented with a line, a discrete line, digital, or bars. For more information, see Trend Series . |
|
Assigned axis |
Select Left to connect the series to the left y axis. Select Right to connect the series to the right y axis. |
|
Weight |
Type the weight of the line. The value has no correlation to any unit of measure. |
|
Show markers |
Select True to show a marker for each record. The marker can only be shown for lines and discrete lines, not for digital and bars. |
|
Show events |
Select True to show events. |
|
Color |
Select a color for the series. |
 Trend Chart Series in WebStation
 Trend Series
 Trend Chart Series Menu
 Trend Chart Settings Dialog Box – Axis Tab
 Trend Chart Settings Dialog Box – Calculation Tab