User Interface
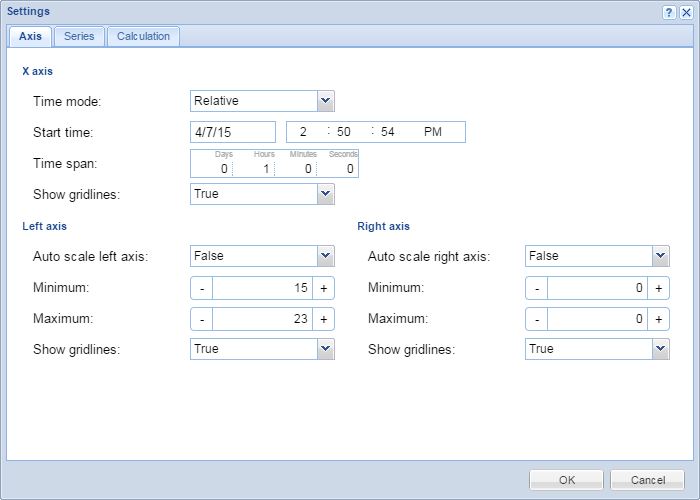
Trend Chart Settings Dialog Box – Axis Tab
Use the Axis tab in WebStation to change the settings for the x axis, y axis, and grid line of a trend chart.

|
Component |
Description |
|
Time mode |
Select the time mode of the x axis. |
|
Start time |
Enter the absolute start time when Time mode is set to Absolute . This time is the leftmost point of the x axis. For more information, see Configuring the X Axis with an Absolute Time Span . |
|
Time span |
Type the relative time span of the x-axis when Time mode is set to Relative . The rightmost point of the x axis is the current time. For more information, see Configuring the X Axis with a Relative Time Span . |
|
Show gridlines |
Select True to show gridlines originating from the x axis scale. For more information, see Showing Trend Chart Grid Lines . |
|
Auto scale left axis |
Select True to activate auto scale. The scale of the left axis automatically adapts to the displayed series. For more information, see Automatically Configuring the Y Axis Scale . Clear to deactivate auto scale. Manually scale the left axis by typing values in the Minimum and Maximum boxes. |
|
Minimum |
Type the minimum value of the left axis. For more information, see Manually Configuring the Y Axis Scale . |
|
Maximum |
Type the maximum value of the left axis. For more information, see Manually Configuring the Y Axis Scale . |
|
Show grid lines |
Select True to show grid lines originating from the left axis scale. For more information, see Showing Trend Chart Grid Lines . |
|
Auto scale right axis |
Select True to activate auto scale. The scale of the right axis automatically adapts to the displayed series. For more information, see Automatically Configuring the Y Axis Scale . Clear to deactivate auto scale. Manually scale the right axis by typing values in the Minimum and Maximum boxes. |
|
Minimum |
Type the minimum value of the right axis. For more information, see Manually Configuring the Y Axis Scale . |
|
Maximum |
Type the maximum value of the right axis. For more information, see Manually Configuring the Y Axis Scale . |
|
Show grid lines |
Select True to show grid lines originating from the right axis scale. For more information, see Showing Trend Chart Grid Lines . |
 Trend Chart Axes in WebStation
 Trend Series
 Configuring the X Axis with an Absolute Time Span
 Configuring the X Axis with a Relative Time Span
 Showing Trend Chart Grid Lines
 Automatically Configuring the Y Axis Scale
 Manually Configuring the Y Axis Scale
 Trend Chart Settings Dialog Box – Calculation Tab
 Trend Chart Settings Dialog Box – Series Tab