
Ratgeber
X-Achse mit relativer Zeitspanne konfigurieren
Sie konfigurieren die Zeitspanne der X-Achse eines Trenddiagramms relativ zur aktuellen Endpunktzeit der Serie, um automatisch das Trenddiagramm anzupassen, um die aktuelle Zeit und die neuesten Aufzeichnungen innerhalb der bestimmten Zeitspanne anzuzeigen.
The x-axis of the trend chart represents time. The time span of the axis can be set with a fixed start and end time or with an end time relative to the present time. The axis can be quick-scaled to show the last hour, last day, last month, or last year.

The y-axis refers to the measurement unit that the variable represents. The scale of the y-axis can be set manually or by auto scale. You can configure the trend chart to present series on one y-axis or two y-axes, one to the left and one to the right. Use two y-axes to present series with different ranges in the same trend chart.

To make reading easier, grid lines can be shown in the trend chart. Grid lines can be shown in both the x- and y-direction, independent of each other.

Wählen Sie in WebStation im Systembaum das Trenddiagramm, das Sie konfigurieren möchten.
Klicken Sie auf der Werkzeugleiste Trenddiagramm auf das Feld Einstellungen .
Klicken Sie auf die Registerkarte Achse .
Wählen Sie im Feld Zeitmodus die Option Relativ .
action_zoom_plus_stroke 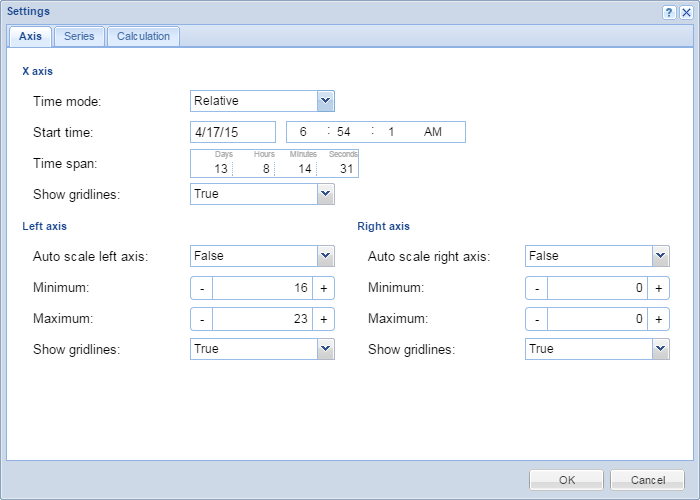
Geben Sie in das Feld Zeitspanne die Zeitspanne ein.
Klicken Sie auf Ok .
Die X-Achse ist nun mit einer Zeitspanne relative zur aktuellen Zeit konfiguriert.
 Trenddiagrammachsen in WebStation
X-Achse mit absoluter Zeitspanne konfigurieren
Rasterlinien im Trenddiagramm anzeigen
Manuelle Konfiguration der Y-Achsenskalierung
Automatische Konfiguration der Y-Achsenskalierung
Aktuelle Trenddiagrammeinstellungen speichern
Trenddiagrammansicht
Trenddiagrammachsen in WebStation
X-Achse mit absoluter Zeitspanne konfigurieren
Rasterlinien im Trenddiagramm anzeigen
Manuelle Konfiguration der Y-Achsenskalierung
Automatische Konfiguration der Y-Achsenskalierung
Aktuelle Trenddiagrammeinstellungen speichern
Trenddiagrammansicht
 Trend Chart Toolbar
Dialogfeld Trenddiagrammeinstellungen – Registerkarte Achse
Trend Chart Toolbar
Dialogfeld Trenddiagrammeinstellungen – Registerkarte Achse