Log on to rate and give feedback
1
2
3
4
5
Log on to rate
0

Ratgeber
Produkte:
WebStation
Funktionen:
Trends
Produktversion:
1.8, 1.9
18.03.2016
Automatische Konfiguration der Y-Achsenskalierung
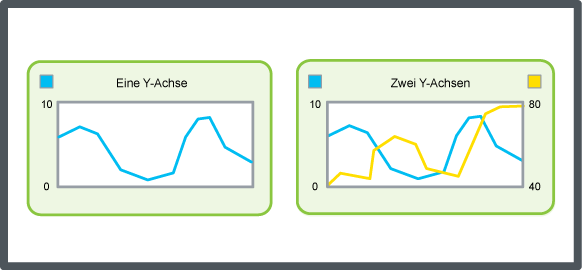
Sie können das Trenddiagramm so konfigurieren, dass es automatisch die Y-Achse skaliert. Das Trenddiagramm verfügt über zwei Y-Achsen, eine links und eine rechts. Anhand dieses Verfahrens können Sie beide Achsen skalieren.
Um die Y-Achsenskalierung automatisch zu konfigurieren
Wählen Sie in WebStation im Systembaum das Trenddiagramm, das Sie konfigurieren möchten.
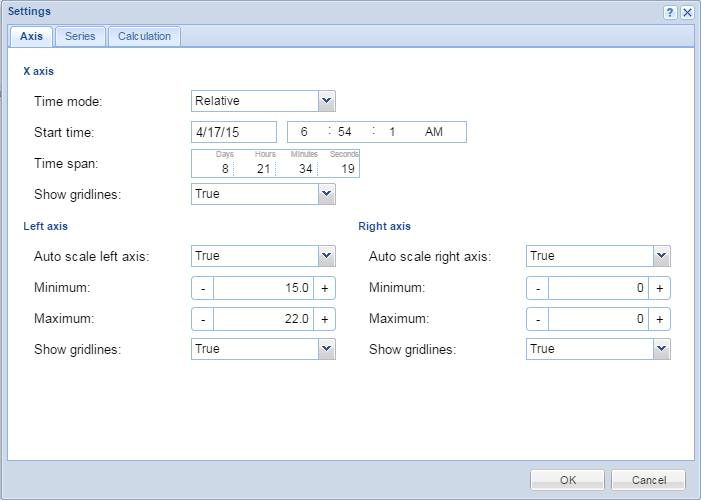
Klicken Sie auf der Werkzeugleiste Trenddiagramm auf das Feld Einstellungen .
Wählen Sie im Feld Automatische Skalierung linke Achse und Automatische Skalierung rechte Achse die Option Wahr .
action_zoom_plus_stroke 
Klicken Sie auf Ok .
 Trenddiagrammachsen in WebStation
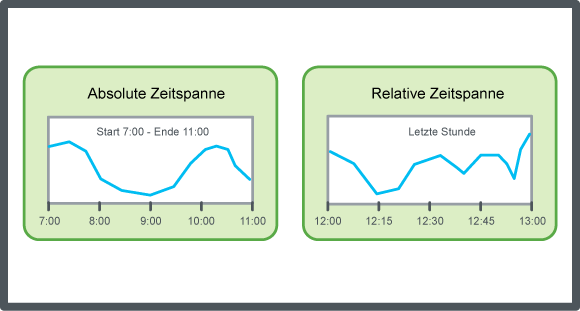
 X-Achse mit relativer Zeitspanne konfigurieren
 X-Achse mit absoluter Zeitspanne konfigurieren
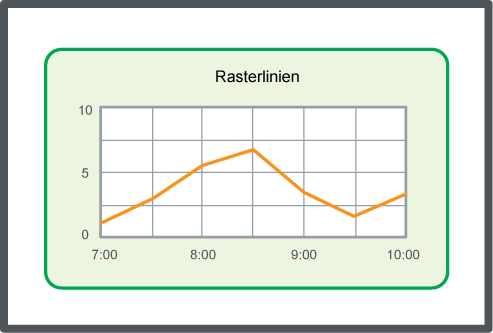
 Rasterlinien im Trenddiagramm anzeigen
 Manuelle Konfiguration der Y-Achsenskalierung
 Aktuelle Trenddiagrammeinstellungen speichern
 Trenddiagrammansicht
 Dialogfeld Trenddiagrammeinstellungen – Registerkarte Achse


