Explicación de procesos
Configuración del eje X con un intervalo de tiempo relativo
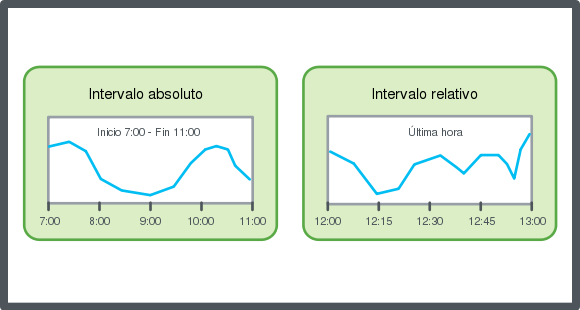
Puede configurar el intervalo de tiempo del gráfico de tendencias del eje X en relación con el tiempo de punto de fin de la serie actual para adaptar automáticamente el gráfico de tendencias y que se muestre la hora actual y los últimos registros dentro del intervalo de tiempo específico.
En WebStation, en el panel Árbol del sistema , seleccione el gráfico de tendencias que desee configurar.
En la barra de herramientas Gráfico de tendencias , haga clic en el botón Preferencias
.action_zoom_plus_stroke 
En el cuadro de diálogo Preferencias , haga clic en la pestaña Eje X .
En el cuadro Modo de tiempo , seleccione Relativo (a la hora actual) .
En el cuadro Intervalo de tiempo , introduzca el intervalo de tiempo.
Haga clic en Aceptar .
Haga clic en Guardar .
El eje X queda configurado con un intervalo de tiempo relativo al tiempo actual.
 Ejes del gráfico de tendencias en WebStation
 Configuración del eje X con un intervalo de tiempo absoluto
 Visualización de las líneas de cuadrícula de un gráfico de tendencias
 Configuración manual de la escala del eje Y
 Configuración automática de la escala del eje Y
 Cómo guardar la configuración del gráfico de tendencias actual
 Vista del gráfico de tendencias
 Barra de herramientas del gráfico de tendencias
 Cuadro de diálogo Configuración del gráfico de tendencias – Pestaña Eje X


