Log on to rate and give feedback
1
2
3
4
5
Log on to rate
0

How to
Products:
WebStation
Functionalities:
Trends
Product version:
1.8, 1.9
6/25/2015
Configuring the X Axis with an Absolute Time Span
You configure the time span of a trend chart x-axis to display the records that are recorded within a specific period of time.
To configure the x axis with an absolute time span
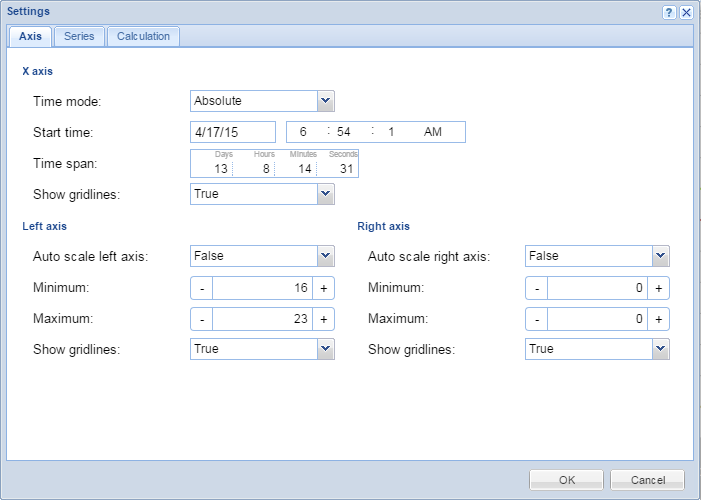
In WebStation, in the System Tree pane, select the trend chart you want to configure.
Click the Axis tab.
On the Trend Chart toolbar, click Settings .
In the Time mode box, select Absolute .
action_zoom_plus_stroke 
In the Start Time box, type the x axis leftmost date and time.
In the Time span box, type the x axis rightmost date and time.
Click OK .
The x-axis is now configured with an absolute time span.
 Trend Chart Axes in WebStation
 Configuring the X Axis with a Relative Time Span
 Showing Trend Chart Grid Lines
 Manually Configuring the Y Axis Scale
 Automatically Configuring the Y Axis Scale
 Saving Current Trend Chart Settings
 Trend Chart View
 Trend Chart Toolbar
 Trend Chart Settings Dialog Box – Axis Tab


