Log on to rate and give feedback
1
2
3
4
5
Log on to rate
0

How to
Products:
WebStation
Functionalities:
Trends
Product version:
2024, 7.0
12/2/2024
Showing Trend Chart Grid Lines
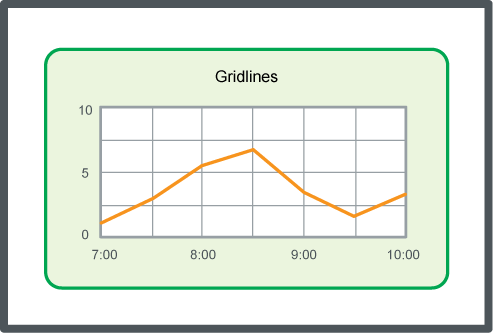
You show the trend chart grid lines on the x-axis and the y-axis to make the chart easier to read.
To show trend chart grid lines
In WebStation, in the System Tree pane, select the trend chart you want to configure.
On the Trend Chart toolbar, click the Settings button
.action_zoom_plus_stroke 
In the Settings dialog box, click the X axis tab.
In the Show gridlines for X-axis box, select True .
Click the Left axis tab.
In the Show gridlines for left Y-axis box, select True .
Click the Right axis tab.
In the Show gridlines for right Y-axis box, select True .
Click OK .
Click Save .
Grid lines are now shown in the trend chart.
 Trend Chart Axes in WebStation
 Configuring the X-axis with a Relative Time Span
 Configuring the X-axis with an Absolute Time Span
 Manually Configuring the Y-Axis Scale
 Automatically Configuring the Y-axis Scale
 Saving Current Trend Chart Settings
 Trend Chart View
 Trend Chart Settings Dialog Box – Right Axis Tab
 Trend Chart Settings Dialog Box – Left Axis Tab


