Modalità
Configurazione manuale della scala dell'asse Y
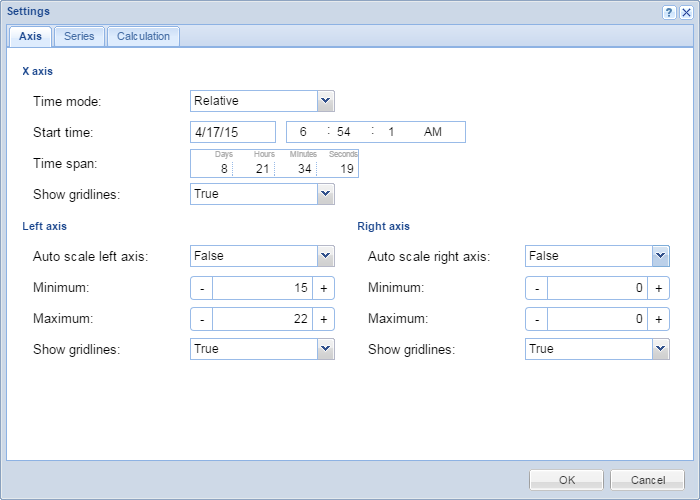
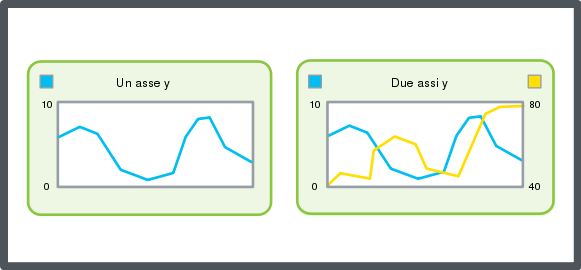
Puoi configurare manualmente l'asse y del grafico di tendenza per ottenere una scala fissa. Il grafico di tendenza presenta due assi y, uno a sinistra e uno a destra. Puoi utilizzare questa procedura per mettere in scala entrambi gli assi.
In WebStation, nel riquadro Struttura del sistema, seleziona il grafico del Trend che desideri configurare.
Nella barra strumenti grafico del Trend, fai clic su Impostazioni .
Nella casella Autoscala asse di sinistra e nella casella Autoscala asse di destra seleziona Falso .
action_zoom_plus_stroke 
Nelle caselle Minimo valore asse di sinistra e Massimo inserisci il valore massimo dell'asse di sinistra.
Nelle caselle Minimo valore asse di destra e Massimo inserisci il valore massimo dell'asse di destra.
Fai clic su Ok .
 Assi dei grafici del Trend in WebStation
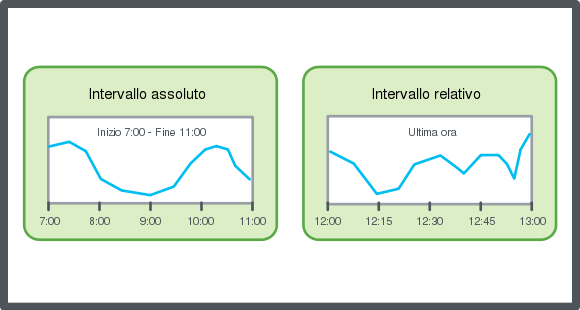
 Configurazione dell'asse X in base a un intervallo di tempo relativo
 Configurazione dell'asse X in base a un intervallo di tempo assoluto
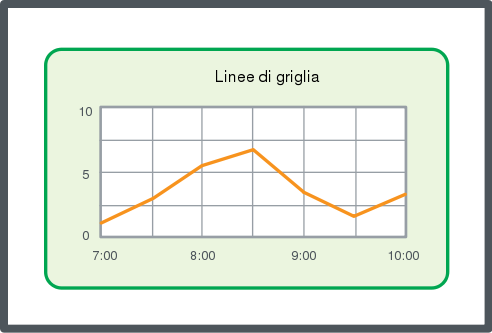
 Visualizzazione delle linee della griglia di un grafico di tendenza
 Configurazione automatica della scala dell'asse Y
 Salvataggio delle impostazioni attuali di un grafico del Trend
 Visualizzazione Grafico del Trend
 Finestra di dialogo Impostazioni grafico del Trend – Scheda Assi


