Log on to rate and give feedback
1
2
3
4
5
Log on to rate
0

Comment faire pour
Produits :
WebStation
Fonctionnalités :
Tendances
Version produit :
1.8, 1.9, 2.0, 2.1, 3.0, 3.1, 3.2, 3.3, 2022, 2023, 2024, 7.0
20/10/2014
Ajout d'une série de journaux de tendance à une courbe de tendance
Vous pouvez ajouter une série de journaux de tendance à une courbe de tendance pour comparer les données de tendance à partir de différents journaux ou variables.
Pour ajouter une série de journaux de tendance à une courbe de tendance
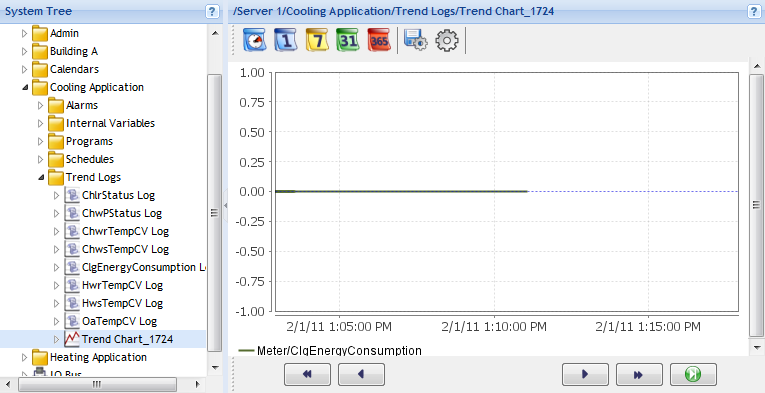
Dans WebStation, dans le volet Arborescence du système , sélectionnez la courbe de tendance à laquelle vous voulez ajouter une série de journaux de tendance.
action_zoom_plus_stroke 
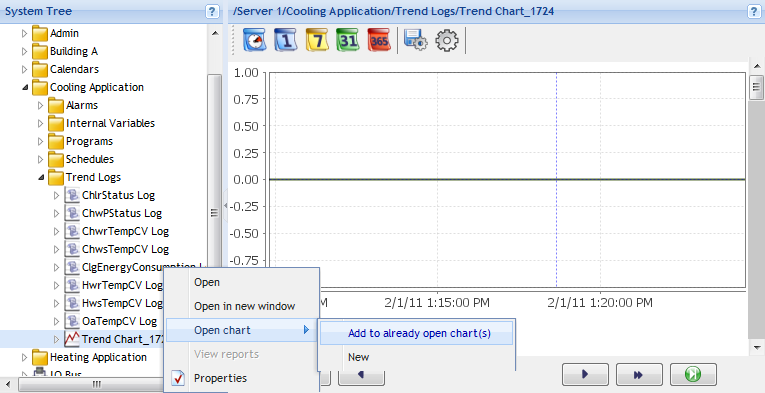
Dans le volet Arborescence du système , cliquez avec le bouton droit sur le journal de tendance, pointez sur Ouvrir le graphique , puis sélectionnez Ajouter au(x) graphique(s) déjà ouvert(s) .
action_zoom_plus_stroke 
Pour enregistrer les modifications apportées à la courbe de tendance, cliquez sur le bouton Enregistrer les paramètres actuels
.action_zoom_plus_stroke 
La série de journal de tendance est désormais ajoutée à la courbe de tendance.

Figure :
Courbe de tendance présentant deux séries de journal de tendance
 Trend Chart Series in WebStation
 How Trend Charts Work
 Displaying Specific Time Spans of a Trend Chart
 Changing the Line Weight of a Trend Chart Series
 Changing the Color of a Trend Chart Series
 Changing the Presentation Type of a Trend Chart Series
 Showing Markers in a Trend Log Series
 Show Tooltips for All Series in a Trend Chart
 Masquage d'une série dans une courbe de tendance
 Removing a Trend Chart Series
 Saving Current Trend Chart Settings
 Trend Chart View
 Context Menu
 Context Menu – Trend Charts Submenu
 Trend Chart Toolbar
