Energy monitoring reports are based on the measurement of energy at meters within a site. You need to create a hierarchy of sites and meters before you generate energy monitoring reports. The meter hierarchy provides the source from which energy reports are generated. Energy monitoring reports are contained in the Energy Monitoring folder.
You create sites and meters in a special folder that is initially called the Energy folder (you can rename it later). However, the Energy folder is not automatically displayed in the System Tree pane, you have to create it there. The Energy folder cannot be used for any purpose except the creation of sites and meters.
Para obtener más información, consulte Creating the Energy Folder
.
Aviso
Do not create more than one Energy folder, even though it is possible to do so (future versions may not support multiple Energy folder creation). Furthermore, you must create the Energy folder in the root of the Enterprise Server.
Sites and Meters
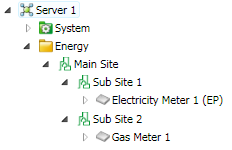
A site represents the location of your meter (or group of meters). If you have meters located across several sites or buildings, you can also create sub-sites and organize the site hierarchy to be the same as the main site layout.
action_zoom_plus_stroke

Figura:
Sites and meters in the Energy folder
Monitoring Meter Consumption
To obtain meter consumption readings, you must first connect your meters to your Enterprise Server by way of a protocol such as Modbus.
Para obtener más información, consulte Modbus Overview
.
When you have connected the meters, you create the meter devices in WorkStation and then create an analog input for each required meter output.
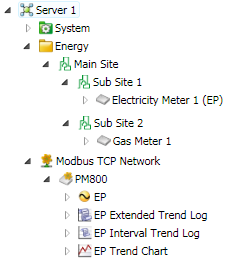
For example, in the following figure, the PM800 Modbus device has an analog input (EP) that represents an actual energy output (in kWh) from the PM800 energy meter:
action_zoom_plus_stroke

Figura:
PM800 meter object with three analog inputs and three extended trend logs
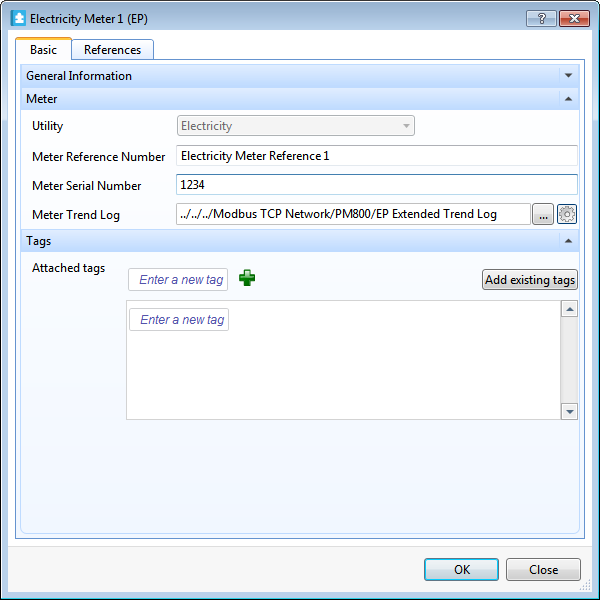
However, to obtain consumption readings for your energy reports, you must associate an extended trend log with each meter that you create in a site. You therefore need to create a trend log for each analog input. In the previous figure for example, the EP Extended Trend Log monitors the EP analog input, and Electricity Meter 1 (EP) associates with the EP Extended Trend Log. You achieve this by way of the meter object basic properties:
action_zoom_plus_stroke

Figura:
Association of an extended trend log with a meter object
Conversion and Addition of Meter Consumption Values
When preparing energy reports, EcoStruxure Building Operation software adds together the consumption values for all meters of the same utility within the Site folder (and its sub-folders). If the consumption units differ between meters, EcoStruxure Building Operation software first converts them to a common unit (kWh for electricity meters, and m
3
for gas meters).
In the PM800 meter described earlier, Sub Site 1 contains one electricity meter monitoring real energy in kWh. If (for example) Sub Site 1 contained three meters each using different consumption units (kWh, MWh, and Wh), the MWh and Wh values would first be converted into kWh, before all three meters were added with the results being displayed (in kWh) in all energy reports you generate.
For gas meters, all valid units (in
3
and ft
3
) are converted into m
3
before addition. All other unit types are ignored and excluded from energy reports.
Energy Unit Configuration Errors
When you run one of the three different types of energy reports, it is possible that the report contains an error message informing you that energy units are not configured correctly. For example, you configured a power unit (W) instead of an energy unit (Wh), or you did not assign any unit at all. In these circumstances you need to know which extended trend log is incorrectly configured, and you can find out by clicking directly on the error message link. The subsequent report contains details of relevant trend logs and of the associated energy meter.
Para obtener más información, consulte Energy Unit Configuration Errors
.
Energy Object Tagging
When configuring energy objects (sites and meters) you can attach (or remove) tags that enable you to categorize energy data in your customized energy reports. When you have attached tags in your site or meter properties, you can create a customized report in MS Report Builder and select the tags (as fields in the Query Designer) that you want to show in your energy report.
Para obtener más información, consulte Energy Object Tagging
.
Energy Monitoring Calendar Consumption Report
The Energy Monitoring Calendar Consumption report displays daily energy consumption. A monthly thumbnail view of each day shows the consumption in a line graph view. You can zoom in on a specific day or select multiple days and see the days overlaid on each other. This report shows consumption trends, and is useful for identifying deviations and exceptions.
Para obtener más información, consulte Energy Monitoring Calendar Consumption Report
.
Energy Monitoring Consumption Report
The Energy Monitoring Consumption report compares the energy consumption of one or more power meters with a target value. You can select a period or date range, as well as specific meters and buildings. The report compares the same or multiple meters over the same or different periods.
Para obtener más información, consulte Energy Monitoring Consumption Report
.
Energy Monitoring Consumption Breakdown Report
The Energy Monitoring Consumption Breakdown report displays a pie chart that shows the relative cost, units, and CO
2
consumption between different power meters. You can use the report to compare energy usage between power meters.
Para obtener más información, consulte Energy Monitoring Consumption Breakdown Report
.

 Energy Monitoring Reports
 Create Object Wizard – Naming the Object Page
 Creating a Site
 Creating a Meter


