Interfaccia dell'utente
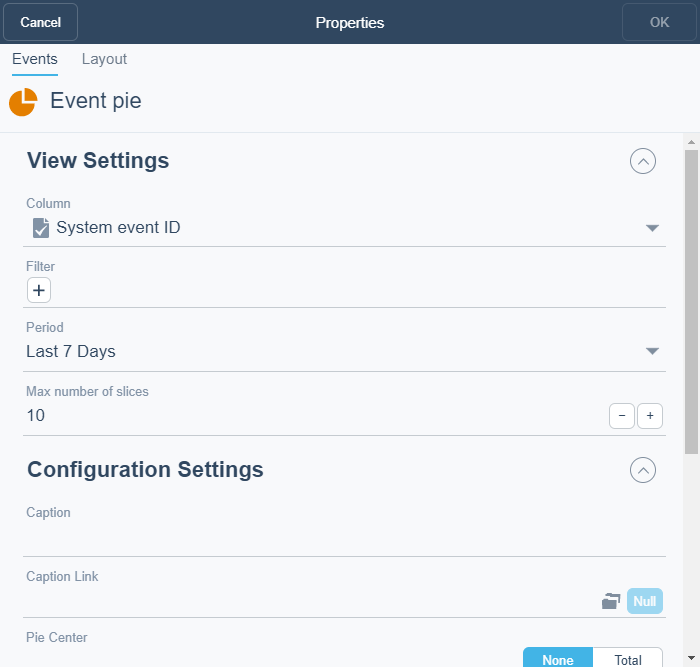
Finestra di dialogo grafico a torta degli eventi
Usare la finestra di dialogo Grafico a torta eventi per configurare e modificare un grafico a torta degli eventi.

|
Componente |
Descrizione |
|
Colonna |
Select the column(s) you want to display in the widget. |
|
Filtro |
Select the filter you want to apply. |
|
Numero max di fette |
Select the number of slices you want to display in the pie chart. |
|
Periodo |
Select the period you want to display. |
|
Didascalia |
Type a caption for the widget. |
|
Link didascalia |
Select to make a link to an object that is relevant to the values that are displayed in the widget. |
|
Centro torta |
Select how you want to display the pie center. Per maggior informazioni, consulta Torta di registro . |
|
Mostra legenda |
Click True to display the name and color of the trend log in the widget. |
|
Mostra percentuale |
Select to display the values in percentage. |
|
Mostra periodo |
Select to display the period as a legend. |
|
Visualizza valore |
Seleziona per visualizzare gli eventi come legende nelle fette. |
|
Decimali |
Select the number of decimals you want to display. |
 Come funzionano i dashboard
 Dashboard Widgets
 Finestra di dialogo Widget – Scheda Layout