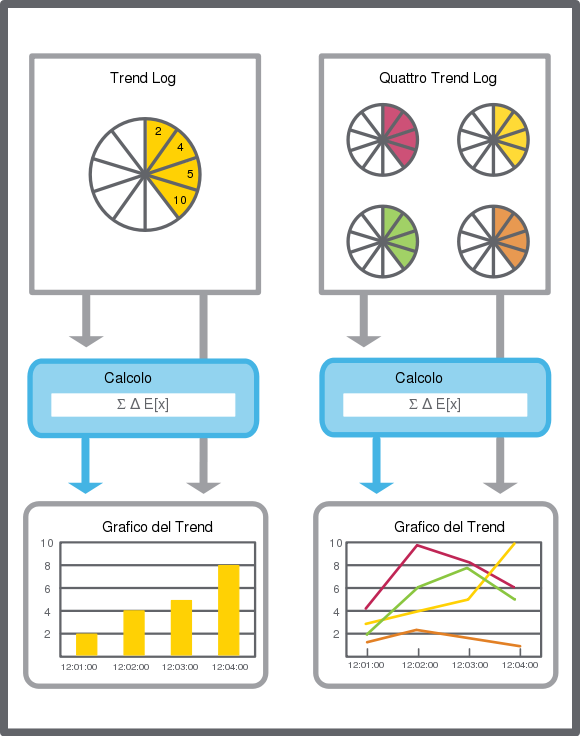
A trend chart displays the records of a trend log or an extended trend log as a series.
Una serie di grafici di trend che presenta un trend log viene automaticamente aggiornata con i record più recenti, se viene attivato un
Aggiornamento live
nella WorkStation o
Scorrimento automatico
nella WebStation. Una serie di un grafico del Trend che presenta registrazioni provenienti da un Trend Log del controllore di campo deve essere aggiornata manualmente.
Non vi è un limite massimo di Trend Log che un grafico del Trend può presentare. Tuttavia, il rendimento diminuisce man mano che i Trend Log visualizzati aumentano. Le registrazioni del Trend Log possono essere elaborate tramite un metodo di calcolo manuale prima di essere presentate nel grafico del Trend. La funzione di calcolo supporta valori di calcolo negativi, che possono essere utilizzati per gestire casi in cui dovete sottrarre il consumo, per esempio, per l'energia prodotta in loco.
action_zoom_plus_stroke

Figura:
Rappresentazione schematica di un grafico del Trend
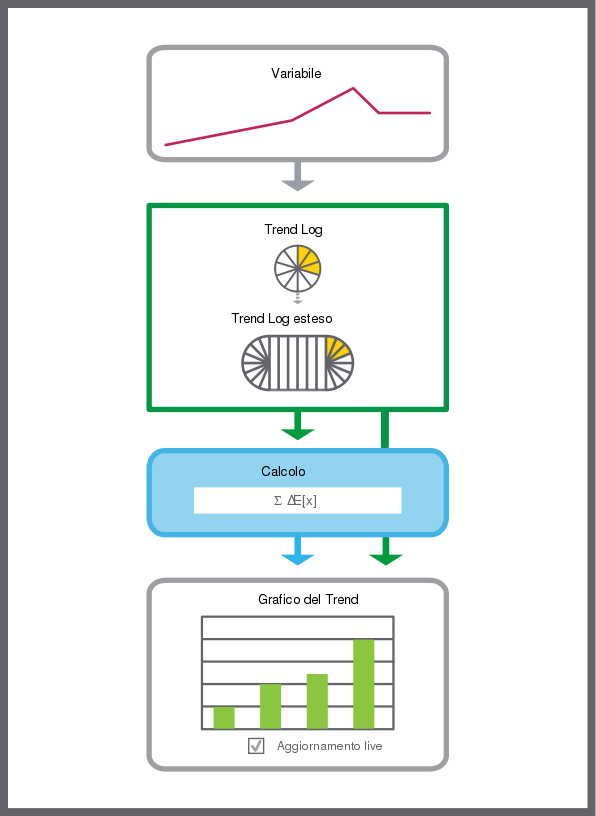
Quando un grafico del Trend presenta registrazioni in tempo reale provenienti da un Trend Log esteso, le registrazioni più recenti del Trend Log collegato vengono frequentemente trasferite al Trend Log esteso. Questo aumenta il ritardo che si verifica quando il Trend Log esteso deve aspettare che sia raggiunta la soglia di trasferimento prima che siano trasferite nuove registrazioni dal Trend Log. Con questo metodo, il grafico del Trend presenta le registrazioni più recenti.
action_zoom_plus_stroke

Figura:
Un Trend Log esteso che presenta un grafico del Trend aperto, trasferisce frequentemente le ultime registrazioni dal Trend Log al Trend Log esteso.
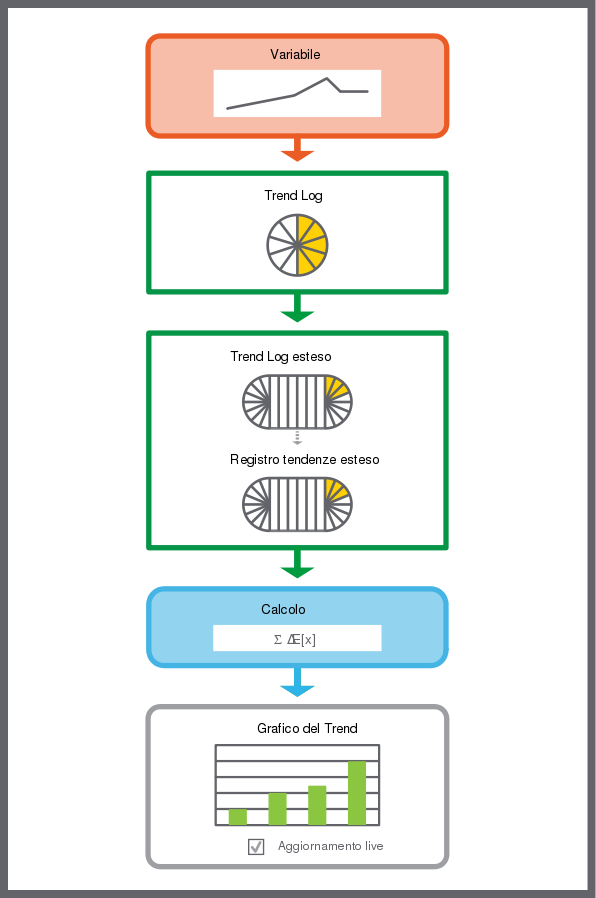
Se i due Trend Log estesi sono collegati con il Trend Log e il grafico del Trend, il trasferimento che si verifica quando un grafico del Trend presenta registrazioni in tempo reale avviene solo per le registrazioni provenienti dal Trend Log esteso più vicino. Questo non influisce sul tasso limite di trasferimento tra il Trend Log e il primo Trend Log collegato.
action_zoom_plus_stroke

Figura:
Registrazione più recente del Trend Log che non presenta la stessa breve latenza in un grafico del Trend in tempo reale quando due Trend Log estesi sono collegati in serie tra il Trend Log e il grafico del Trend.
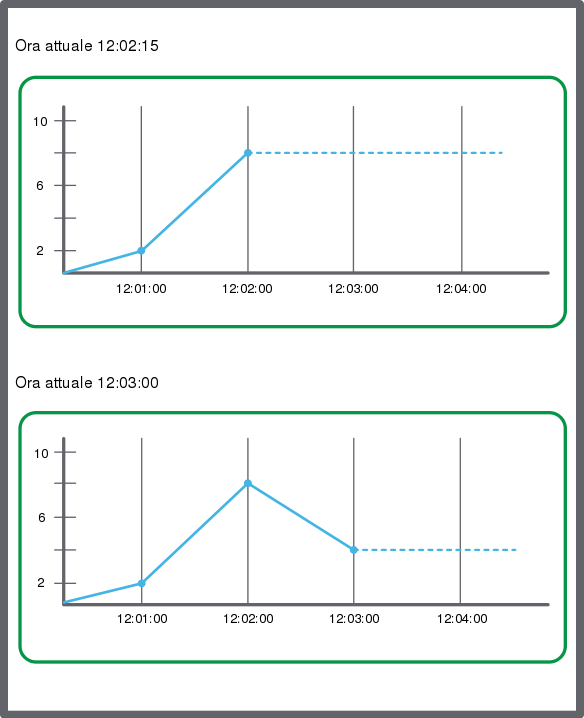
Mentre aspetta una nuova registrazione, il grafico del Trend traccia una linea tratteggiata dall'ultimo valore registrato in avanti. Quando viene registrato un nuovo valore, la linea tratteggiata tra l'ultima e la nuova registrazione viene sostituita da una serie di linee continue.
action_zoom_plus_stroke

Figura:
Se non viene registrato alcun valore, il grafico del Trend traccia una linea tratteggiata.
Titolo grafico Trend dinamico
I grafici di trend supportano i riferimenti relativi alle proprietà relative al titolo del grafico di trend. Puoi riutilizzare il grafico di trend e modificare dinamicamente il titolo del grafico di trend a seconda di dove è stata incollata una copia, eseguito un duplicato, importato o spostato il grafico di trend. La proprietà Titolo del grafico del grafico di trend è la prima parte del titolo del grafico di tendenza e la proprietà Descrizione del grafico di trend è l'ultima parte del titolo del grafico di trend. Ad esempio, in un riferimento proprietà relativo: '../../ NAME' dove '../' rappresenta una cartella o un oggetto contenitore.
Se la proprietà del titolo di grafico è vuota o contiene un riferimento non risolto, il nome dell'oggetto del grafico di trend è la prima parte del titolo del grafico di trend.
Il titolo del grafico di trend è visibile nelle stampe del grafico di trend.
Serie nei grafici di trend
In a trend chart, a series can be presented as a line, discrete line, digital, or bars. In a trend chart, series can be presented in different colors and with different line weights.
In WorkStation, in a multi trend log list, series are presented as text and can be exported to .XML or .CSV.
Per maggior informazioni, consulta Trend Series
.
Assi dei grafici del Trend in WorkStation
The x-axis of the trend chart represents time. The time span of the axis can be set with a fixed start and end time or with an end time relative to the present time. The axis can be quick-scaled to show the last hour, last day, last month, or last year.
Per maggior informazioni, consulta Assi del grafico del Trend
.
Assi dei grafici del Trend in WebStation
The x-axis of the trend chart represents time. The time span of the axis can be set with a fixed start and end time or with an end time relative to the present time. The axis can be quick-scaled to show the last hour, last day, last month, or last year.
Per maggior informazioni, consulta Assi dei grafici del Trend in WebStation
.
Tracciamento in tempo reale
The real-time plot is a variable displayed directly in the trend chart. The real-time plot is an instant reflection of the variable, so the history of the real-time plot is lost when the trend chart is closed. However, the history is not lost for I/O points that have implicit logs where approximately 500 records of history are displayed.
Per maggior informazioni, consulta Real-Time Plotting
.
Modalità fuso orario in un grafico del Trend
In a trend chart, you can present the records of a trend log in different time zones: local time or a predefined time zone.
Per maggior informazioni, consulta Time Zone Modes in a Trend Chart
.
Metodi di calcolo
Use a calculation method to process the records of the trend log before presenting them in a trend log list or a trend chart. The original records in the trend log are not affected by the calculation method. The calculation method is applied to the trend log records grouped by a specific time interval.
Per maggior informazioni, consulta Metodi di calcolo
.
Periodo di tempo di ritardo in grafici del trend ed elenchi del Trend Log
When a calculated value for a period is presented, the middle of the period is used as the timestamp.
Example:
The calculated value for the period 8:00-9:00 is stamped 8:30. If there is a value at 9:01, the next period is 9:00-10:00, which is stamped as 9:30. The full period may not have passed yet, but the value can be presented even if parts of the period are in the future.
Grafici del Trend temporanei
To display a trend log without creating a new trend log list or trend chart, the trend log can be displayed in a temporary list or chart.
Per maggior informazioni, consulta Temporary Trend Charts
.
Elenchi del multi Trend Log
Puoi visualizzare un grafico del Trend in un elenco di multi Trend Log per esportarlo e stamparlo. Il calcolo e le impostazioni di serie del grafico del Trend sono contenute in un elenco di multi Trend Log.
Per maggior informazioni, consulta Multi Trend Log Lists
.
Valori punti flottanti NaN, INF e –INF
In the EcoStruxure Building Operation software, the floating point values “Not a Number”, positive infinity, or negative infinity may be displayed in the
Basic
property tab, in a trend log list, or a trend chart.
Per maggior informazioni, consulta Floating Point Values NaN, INF, and –INF
.

 Grafici del Trend
 Create Object Dialog – Naming the Object Page
 Create Trend Chart Wizard – Configure Trend Chart Page
 Create Object Dialog – Naming the Object Page
 Create Trend Chart Wizard – Configure Trend Log Series Page
 Apertura di un grafico del Trend


